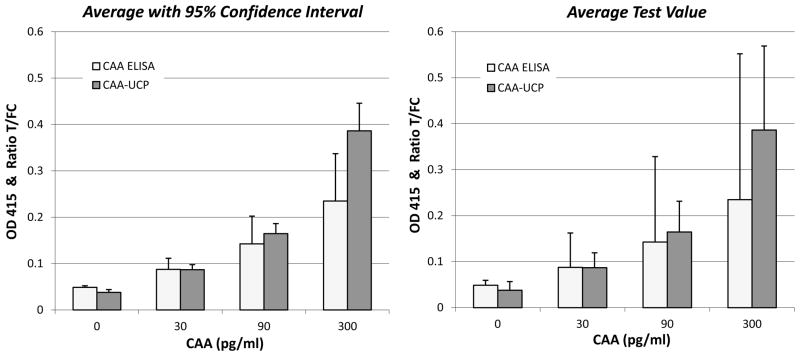
Figure 2.
Comparison between CAA-ELISA and CAA-UCP-LF values for the CAA QC standard dilution series in serum.
Left panel showing the average OD and T/FC values of 38 QC standard series presented in histograms with 1x standard deviation error bars. Right panel showing the same histogram with bars indicating the 95% confidence interval.

