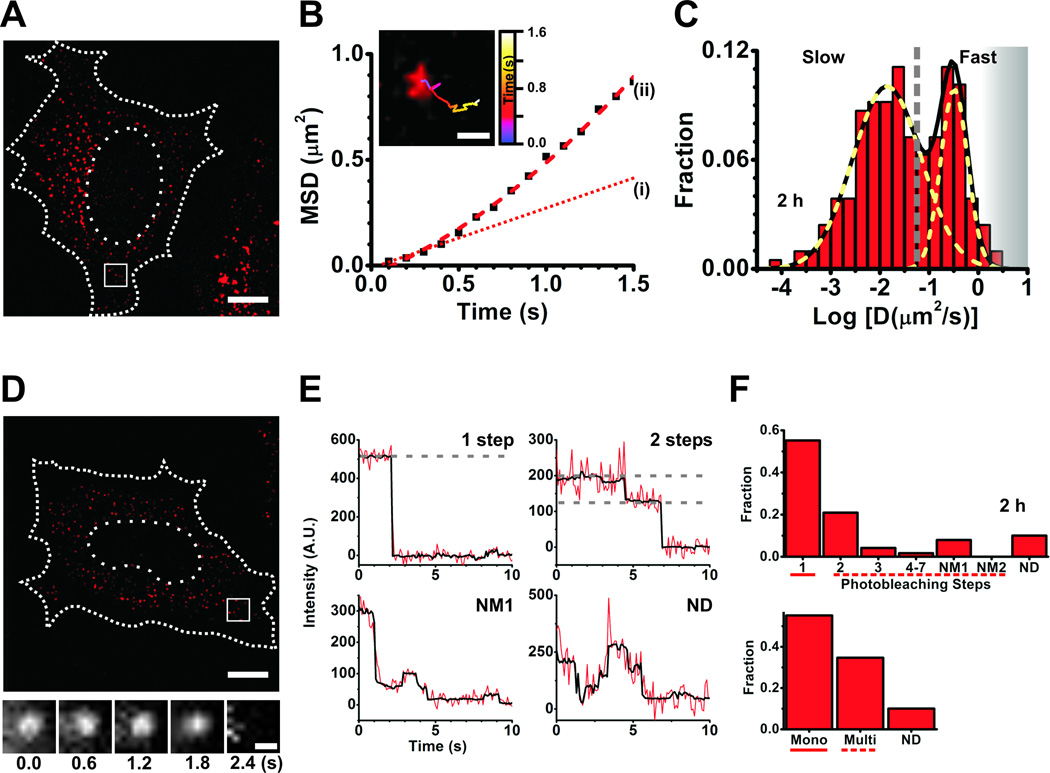
Figure 4.
Single particle tracking and single molecule counting. (A–C) Data from single particle tracking experiments in live HeLa cells. (A) A representative background-subtracted pseudocolored image of a cell injected with 1.5 µM let-7-a1-Cy5 miRNA and fluorescein dextran (injection marker), imaged 2 h post-microinjection. Scale bar, 10 µm. Dashed and dotted lines represent cell and nuclear boundaries, respectively. (B) Plot of mean squared displacement (MSD) versus time of the track within the inset. Scale bar within inset, 500 nm. The track corresponds to the particle within the white box in (A). Brownian micro-diffusion coefficient (D(i)), calculated from the first three data points of the MSD versus time plot, is 0.0561 µm2/s, whereas the diffusion coefficient calculated by best-fitting all data points with a parabolic curve, the canonical equation for a particle exhibiting biased motion, yields D(ii) = 0.085 µm2/s (velocity = 0.43 µm/s). The line fitted to the first three data points is extrapolated for ease of viewing (dotted red line (i)). Based on RD analysis, we do not find a significant difference in the number of particles exhibiting non-Brownian diffusion between sample sets. As we are interested only in the change in diffusion coefficient and not its actual magnitude, such differences do not significantly affect our analyses. (C) Distribution of Brownian micro-diffusion coefficients calculated from individual let-7-a-Cy5 particles in (A), that were visible for at least 9 consecutive frames. Particles distributed into at least two distinct Gaussian populations of diffusion coefficients, with an average of diffusion coefficients of 0.322 µm2/s and 0.014 µm2/s. The grey dashed line represents a crude demarcation of the fast and slow moving particles that resemble mRNPs and PBs, respectively. The grey shaded region represents diffusion coefficients of fast moving particles that we increasingly lose either due to time resolution limitations or due to our stringent track length threshold for calculating diffusion coefficient. (D–F) Data from single molecule counting experiments in formaldehyde-fixed HeLa cells. (D) A representative background subtracted, pseudocolored image of a cell injected with 0.25 µM let-7-a1-Cy5 miRNA and 10 kDa fluorescein-dextran, imaged 2 h after microinjection. Scale bar, 10 µm. Dashed and dotted lines represent cell and nuclear boundaries, respectively. Cells were imaged immediately after fixation. The bottom panel contains a set of frames that shows the photobleaching of a miRNA particle, within the white box in (D), over the indicated time. Scale bar, 500 nm. (E) Representative photobleaching trajectories of particles in (D). Grey dashed lines are drawn to guide the eye to discrete intensity levels. (F) Distribution of photobleaching steps corresponding to particles in (D). The bottom panel represents particles either grouped as monomers (photobleaching steps spanning solid line in top panel), multimers (photobleaching steps spanning dashed line in top panel) or non-discernible (ND).

