
Figure 2.
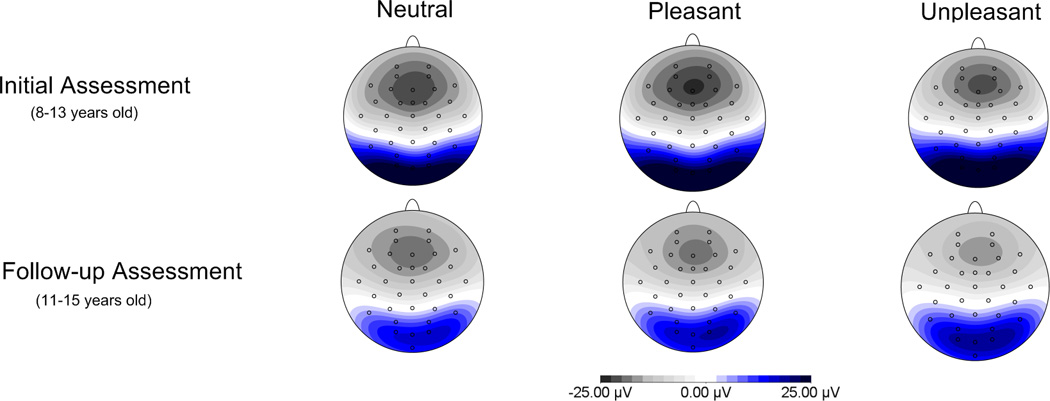
Scalp distributions depicting overall activation at the first and second assessment. Less overall activation was observed over occipital sites at the second assessment relative to the first assessment
Official websites use .gov
A
.gov website belongs to an official
government organization in the United States.
Secure .gov websites use HTTPS
A lock (
) or https:// means you've safely
connected to the .gov website. Share sensitive
information only on official, secure websites.
Scalp distributions depicting overall activation at the first and second assessment. Less overall activation was observed over occipital sites at the second assessment relative to the first assessment