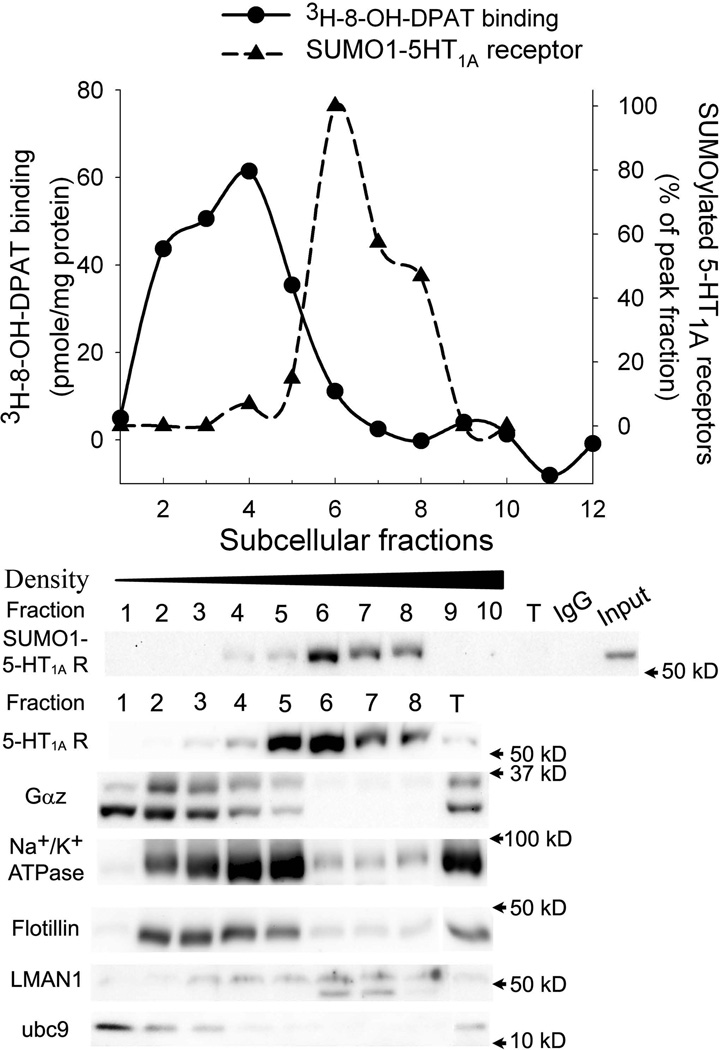
Figure 5. Comparison of the distribution of 3H-8-OH-DPAT binding with that of SUMO1-5-HT1A-R.
Subcellular fractions (1ml/fraction) were generated by discontinuous gradient centrifugation with 10%–40% iodixanol. Each fraction was divided into two parts, one for the 3H-8-OH-DPAT binding assay and one for immunoprecipitation for SUMO1 and immunoblot for 5-HT1A-R, Gαz protein, ubc9 and markers of subcellular organelles. Top graph compares the profiles of the distribution of 3H-8-OH-DPAT binding (solid line) with that of SUMO1-5-HT1A-R (dashed line), in which IOD of the blot was measured and calculated as % of the peak fraction. Bottom panel shows immunoblots of 5-HT1A-R, Gαz protein, ubc 9 and markers of subcellular organelles. The SUMO1-5-HT1A-Rs were determined by immunoprecipitation with SUMO1 antibody followed by 5-HT1A-R.

