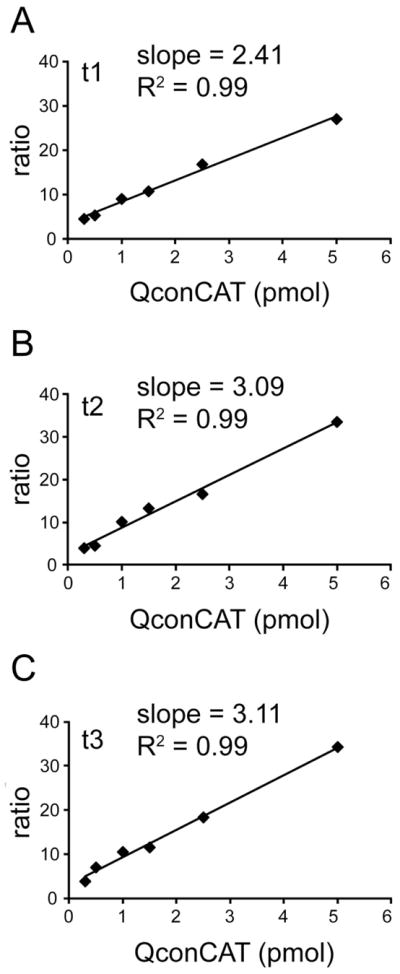
Fig. 2.

Standard curves for the PICALM QconCAT. The linearity of the optimum transitions were verified by spiking six frontal cortex samples (0.2 mg of total tissue protein each) with varying amounts of the PICALM QconCAT. The peak area ratio of a heavy peptide transition (from PICALM QconCAT) to the corresponding light peptide transition (from frontal cortex) is plotted versus the supplemented PICALM QconCAT amount. (A), (B), and (C) show three individual transitions for QAALEEEQAR (Q4); t1 is 572.8/632.3 and 577.8/642.3; t2 is 572.8/874.4 and 577.8/884.4; t3 is 572.8/945.5 and 577.8/955.5.
