
Fig. 4. In vivo comparison of pO2 in control and SMA banded rats using Hypoxyprobe™.
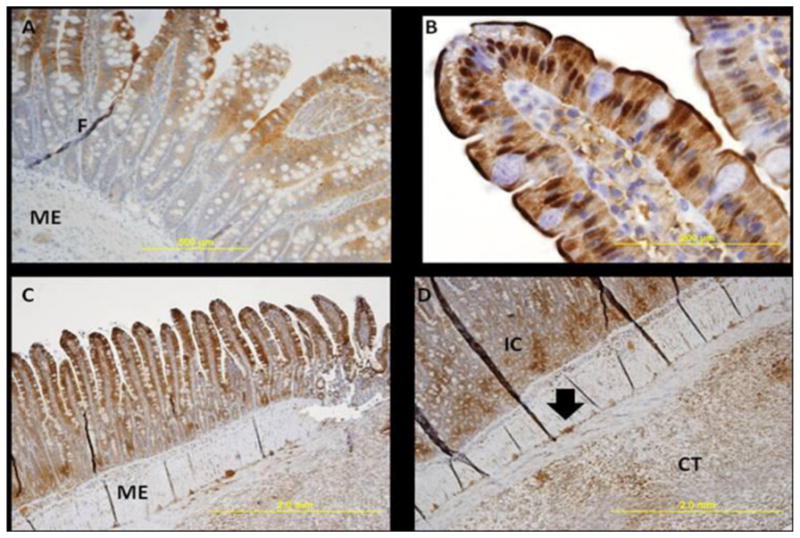
Images were obtained using light microscopy at different magnifications (4x, 10x, 20x, 40x). All images are from ileal tissue. Figure A depicts an image in a control rat, while B, C, and D are SMA-banded rat images. Tissues are stained with HypoxyprobeTM which binds to protein thiol groups in cells with oxygen tension less than 10 mmHg and produces a brown stain. Although a qualitative indicator of the degree of hypoxia, the color intensity of the brown stain relates to the degree of hypoxia with darker intensity interpreted as more hypoxic. Dark lines in the tissues represent tissue folds. A representative tissue fold is labeled as F in diagram A. The following letters mean: CT, subserosal connective tissue, IC, intestinal crypts, and ME, muscularis externa. The closed arrow indicates the myenteric plexus. Images: (A) Represents villus tip staining in a control rat; (B) Illustrates cytoplasmic staining by HypoxyprobeTM of enterocytes on a villi tip; (C) Illustrates a more extensive and deeper brown staining of the ileum; (D) Is a 20x magnification of the image displayed in (C). In this rat the EPR measured pO2 was 7.5 mmHg. Brown stain is seen throughout the connective tissue of the submucosa, circular and longitudinal muscle, and the subserosal connective tissue noted as CT. The arrow indicates neuron hypoxia and further examination illustrates multiple sites of neuron death in all enteric nervous system cells. Not shown, on 40x magnification, both Auerbach’s and Meissner’s plexesus hypoxia was prominent. We were able to rule out death in these areas being attributable to satellite cell death or connective tissue surrounding these neurons.