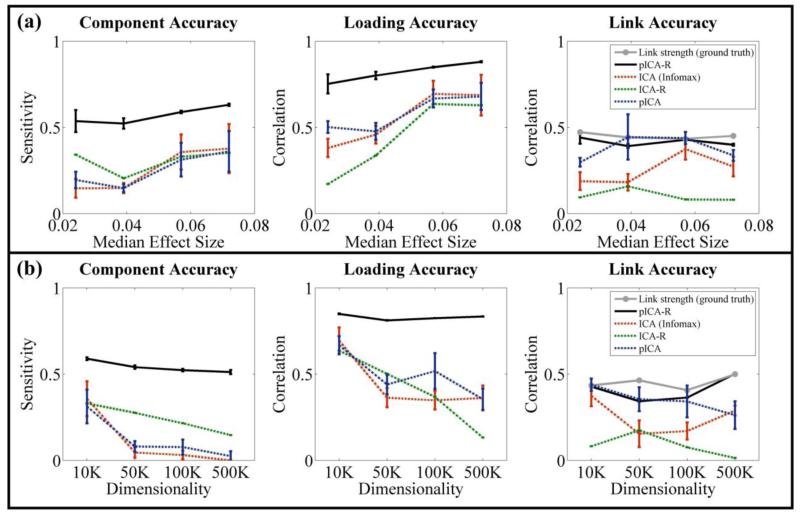
Figure 3.
Performance comparisons among pICA-R, ICA (infomax), ICA-R and pICA: (a) on simulated datasets with different effect sizes when the sample-to-SNP ratio was controlled at 0.02 and causal loci ratio at 0.015; (b) on simulated datasets with SNP dimensionality ranging from 10K to 500K, resulting in sample-to-SNP ratios ranging from 0.02 to 4.00×10⁻⁴ and causal loci ratios from 0.015 to 3.00×10⁻⁴, the median effect sizes were 0.057, 0.055, 0.050 and 0.050 respectively. For pICA-R and ICA-R, results were obtained with a 20-loci reference of accuracy 1. The error bars reflect mean ± SD based on 100 runs.

