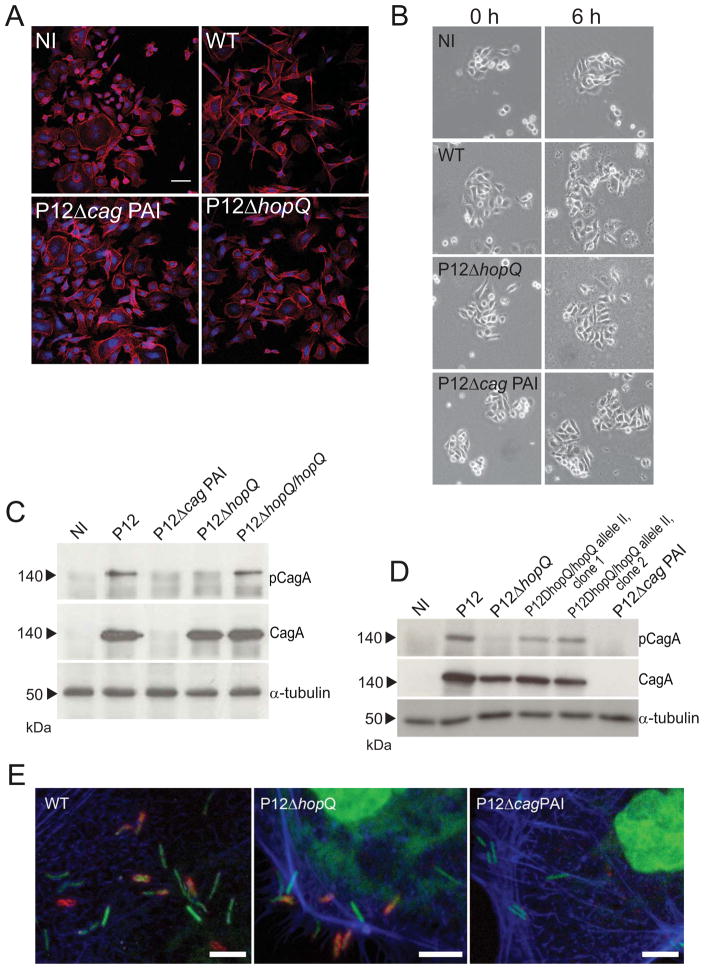
Figure 5. HopQ is essential for CagA translocation.
(A) Development of hummingbird phenotype and (B) scattering in AGS cells upon infection with the H. pylori wild type strain P12 (WT) and with its isogenic mutants P12ΔhopQ and P12ΔcagPAI in comparison to non-infected AGS cells (NI). Development of hummingbird phenotype was assessed by immunofluorescence microscopy at 6 h p.i.. Actin stained by phalloidin A546 is shown in red, DRAQ-strained DNA from nuclei and bacterial chromosome are shown in blue. (C) CagA phosphorylation in AGS cells upon infection with H. pylori wild type strain P12 (WT), with its isogenic mutants P12ΔhopQ and P12ΔcagPAI and the complemented hopQ mutant (P12ΔhopQ/hopQ.) in comparison with non-infected AGS cells (NI). The infection was performed at the MOI of 100 for 3 h. Phosphorylated CagA (pCagA), total amount of CagA (CagA) and AGS cells (β-actin or α-tubulin) were estimated with specific antibodies by immunoblot analysis. Scale bar, 50μm. Scattering of AGS cells was assessed by phase-contrast microscopy at different time points. Blots and microscopy pictures are representative of three independent experiments. (D) CagA phosphorylation in AGS cells upon infection with H. pylori wild type strain P12 (WT), with its isogenic mutants P12ΔhopQ and the H. pylori mutant with exchanged hopQ alleles (P12ΔhopQ/hopQ allele II, clone 1 and clone 2.) and P12ΔcagPAI and in comparison with non-infected AGS cells (NI). The infection was performed at the MOI of 100 for 3 h. Phosphorylated CagA (pCagA), total amount of CagA (CagA) and AGS cells (α-tubulin) were estimated with specific antibodies by immunoblot analysis. (E) Micrographs of immunostaining for CagY (red), a component of T4SS, Phalloidin 488 (blue) and DRAQ5 (green) in H. pylori wild type strain P12 (WT), in its HopQ-deletion mutant (ΔhopQ) and in the cagPAI-deletion mutant (ΔcagPAI) after the infection of AGS cells for 30min. Images are projections of confocal stacks taken with a Leica SP5 confocal microscope Green and blue channels were interchanged to improve visualization of bacteria. (Scale bars: 5μm)

