
Figure 7.
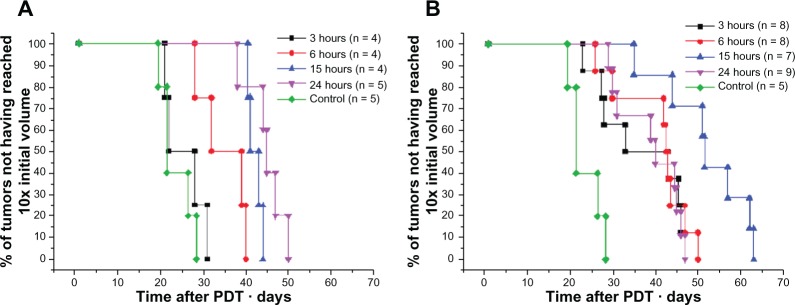
Kaplan–Meier plots of HT29 tumor growth delay after PDT with Foslip®* and Fospeg®* at different DLIs.
Notes: (A) Foslip® and (B) Fospeg®. Cured mice are neither shown nor included in the calculations. *Biolitec Research GmbH, Jena, Germany.
Abbreviations: n, number; PDT, photodynamic therapy; DLI, drug–light interval.