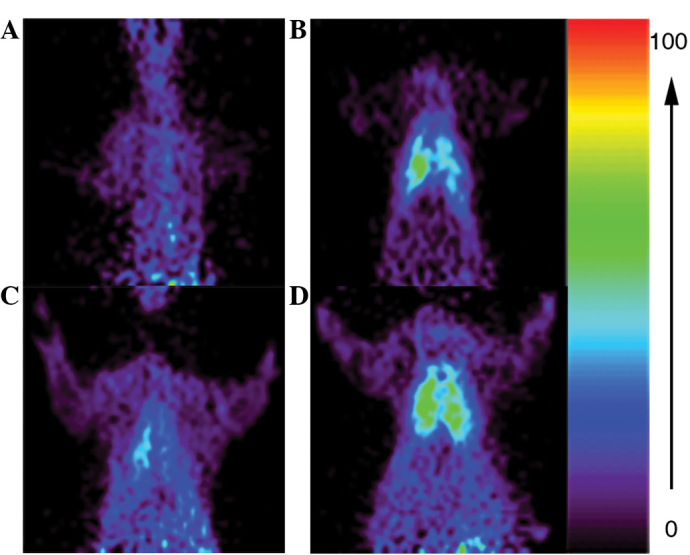
Figure 4.

microPET scans of rats in the (A) NS; (B) LPS; (C) HCl and (D) LPS-HCl groups. The rats in LPS-HCl group displayed higher (18F)FDG uptake than the rats in the other groups. PET, positron emission tomography; NS, normal saline; LPS, lipopolysaccharide; FDG, fluorodeoxyglucose.
