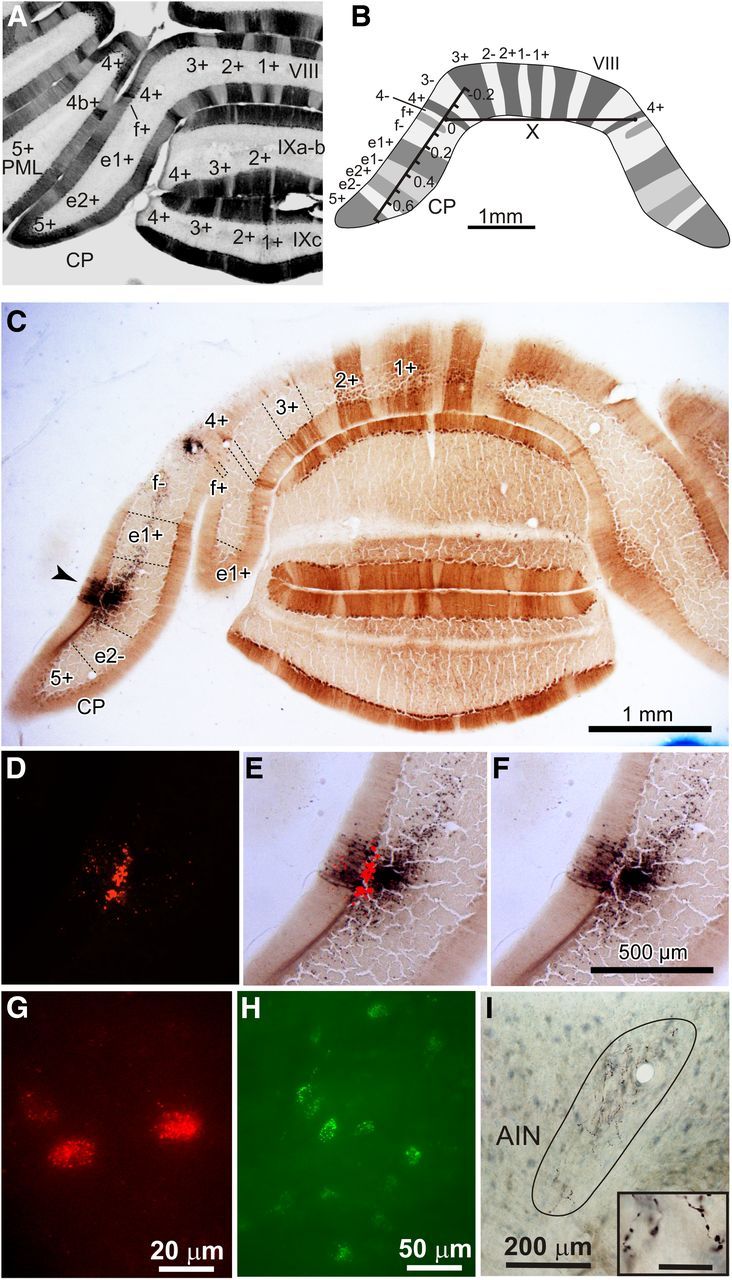
Figure 1.

Photomicrographs of injection sites, labeling, and schematic of zebrin bands. A, Photomicrograph of a coronal section of the rat posterior cerebellum labeled for zebrin together with identification of individual zebrin-positive bands. Zebrin was visualized with diaminobenzidine. PML, paramedian lobule; VIII, vermal lobule 8; IXa-b, vermal lobule 9a-b; IXc, vermal lobule 9c. B, Schematic showing the method used to normalize location of tracer injection sites in CP. A laterality index was determined by measuring the distance from the injection site center to the ipsilateral zebrin band 4+. This value was divided by the length (X) between the centers of the lateral boundary of zebrin band 4+ on the left and right sides of the brain. C, Low-power photomicrograph of coronal section of rat cerebellum labeled for zebrin and showing an example injection site of BDA (arrowhead). D, High-power photomicrograph of C showing the red Retrobeads injection site. E, High-power photomicrograph of C showing overlay between BDA and red Retrobeads injection site. F, High-power photomicrograph of C showing BDA site. Scale bar in F also applies to photomicrographs D and E. G, High-power photomicrograph of olive cells retrogradely labeled with red Retrobeads. H, High-power photomicrograph of pontine cells retrogradely labeled with green Retrobeads. I, High-power photomicrograph showing area occupied by anterogradely labeled PC axon preterminals/terminals in AIN (enclosed by line). Inset: Labeled PC axon terminals in AIN. Scale bar for inset, 20 μm.
