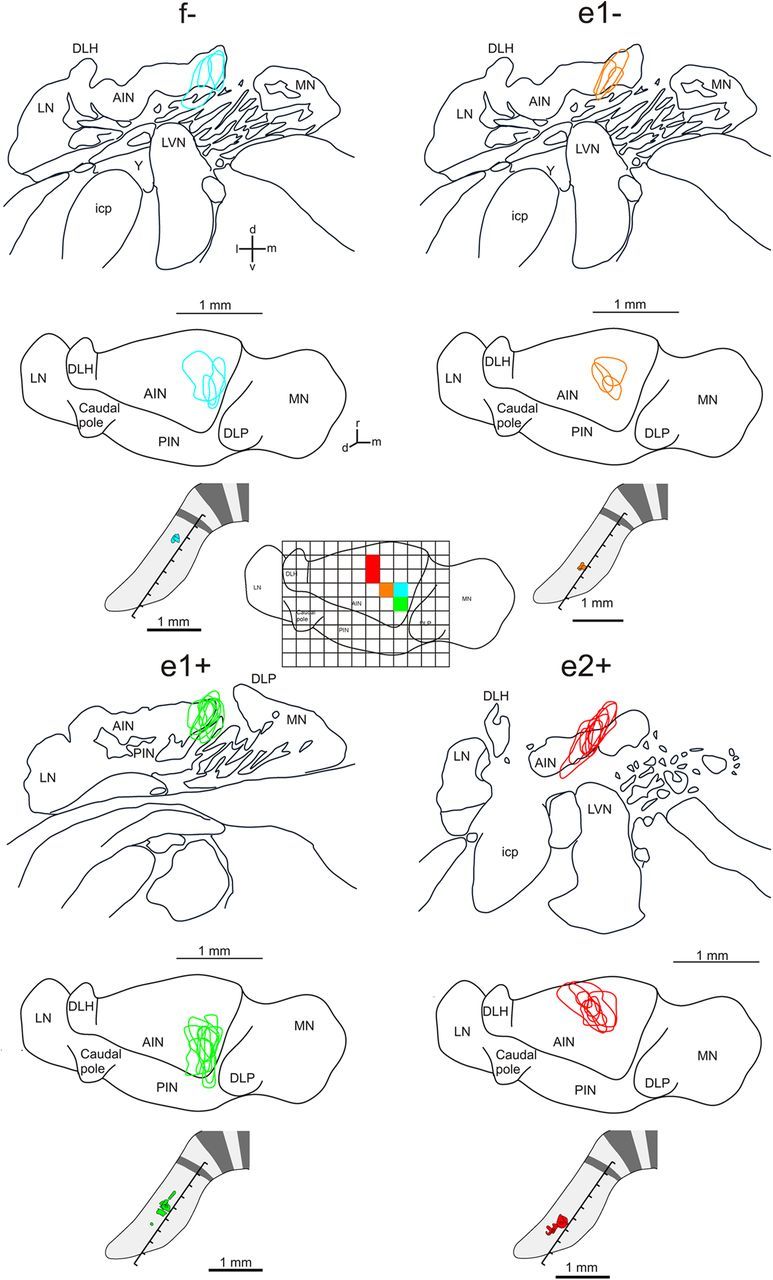
Figure 5.

Pooled cases of corticonuclear projections associated with different zebrin bands in the C1 zone in CP. Each group of maps shows the territory occupied by labeled corticonuclear preterminals/terminals in coronal (upper) and horizontal (middle) views of the left cerebellar nuclei. Bottom panel shows the injection sites on a schematic of CP. Inset in center of figure shows the horizontal view of cerebellar nuclei overlayed with a grid (0.2 mm × 0.2 mm square grating). The corresponding colored squares in AIN show for all cases centered or restricted on a given zebrin band where the greatest overlap of terminal labeling occurred. AIN, anterior interposed nucleus; DLH; dorsolateral hump (of the AIN); d, dorsal; DLP, dorsolateral protuberance (of the MN); icp, inferior cerebellar peduncle; l, lateral; LN, lateral (dentate) nucleus; LVN, lateral vestibular nucleus; m, medial; PIN, posterior interposed nucleus; MN, medial (fastigius) nucleus; r, rostral; v, ventral;Y, nucleus Y.
