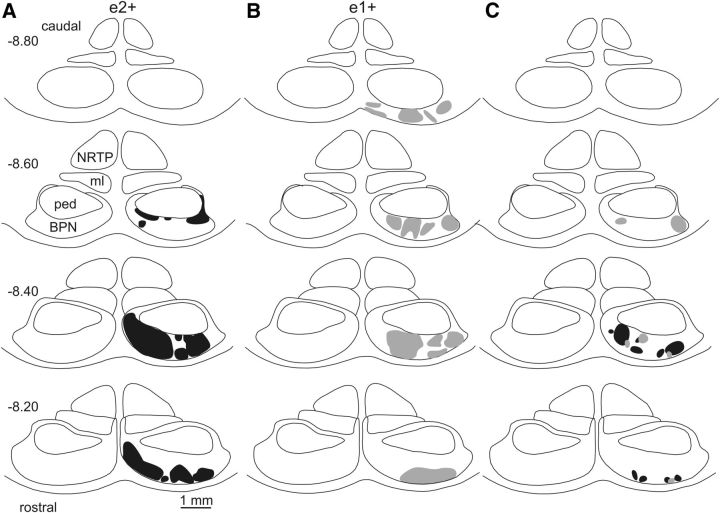
Figure 7.
Pooled cases of pontocerebellar projections associated with different zebrin bands in the C1 zone in CP. A, Standard transverse maps of the pons (AP levels −8.2 to −8.8) showing the total area in BPN occupied by cell labeling (black shading) for all injection sites centered on zebrin band e2+ (n = 4). B, Same as A but for all injections sites centered on zebrin band e1+ (n = 4, gray shading). C, Core areas occupied by cell labeling in at least 3 cases: e2+ (black) and e1+ (gray). BPN, Basilar pontine nuclei; c, caudal; l, lateral; m, medial; ml, medial lemniscus; ped, cerebral peduncle; NRTP, nucleus reticularis tegmenti pontis; r, rostral.

