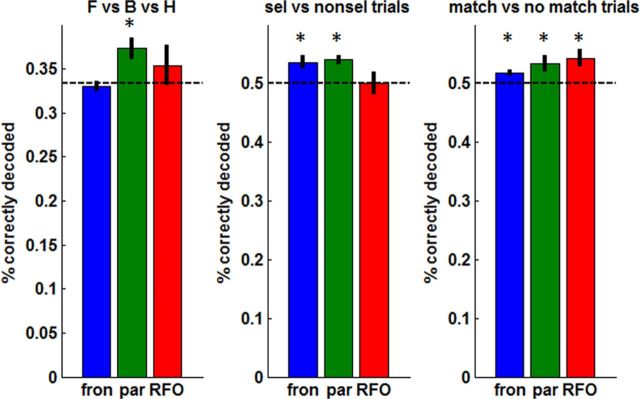
Figure 10.
Decoding in frontal (fron) and parietal (par) areas. Mean ± SEM percentage of correctly classified trials across subjects for a leave-one-trial-out cross-validation approach. The dotted line denotes chance-level performance. *p < 0.05, performance significantly different from chance (one-sample t test). Left, Decoding attended stimulus category (face vs body vs house). Middle, Decoding trial type: selectively versus nonselectively attended trials. Right, Decoding response type: match (attended stimulus present in triplet array) versus no-match (attended stimulus absent). RFO, Right FO.

