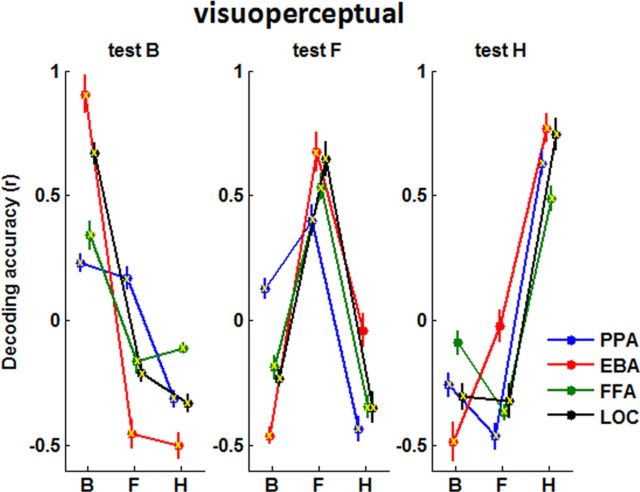
Figure 3.
Visuoperceptual decoding. Decoding accuracy (y-axis) is given by the correlation between a training pattern, indicated here within each panel, and a test pattern, one per panel. The training and test data are visuoperceptual data from two independent MRI sessions in the same participant. The highest decoding accuracy per panel predicts at which object category a subject is looking. The different privileged areas are indicated by different colors. Mean ± SEM decoding accuracy are plotted. B, bodies; F, faces; H, houses. Lines are plotted to guide the eye only. Yellow crosses indicate correlations significantly different from 0 (one-sample t test, p < 0.05).

