
Figure 2.
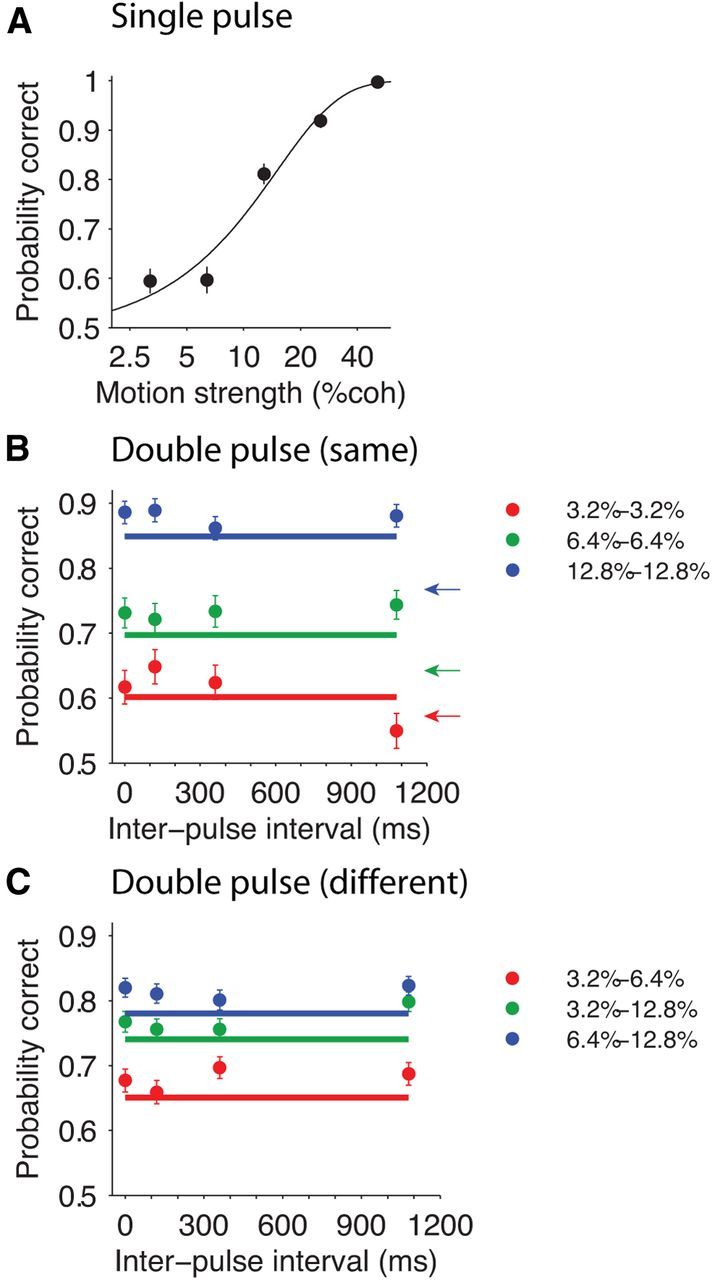
Choice accuracy in double-pulse trials was independent of the interpulse interval. A, Accuracy in single-pulse trials. The curve is the fit of a logistic function (Eq. 1) to the data. B, Accuracy in double-pulse trials with same pulse strengths. Horizontal lines show the expected accuracy of a perfect integrator based on the single-pulse performance. Arrows show the value of the logistic fit for single-pulse trials of similar motion strength. C, Accuracy in double-pulse trials with different pulse strengths. Each data point represents pooled data from the pulse sequence indicated by the legend and its reverse order (e.g., 3.2–6.4% and 6.4–3.2%). Horizontal lines show the expected accuracy of a perfect integrator based on single-pulse performance. Error bars indicate SEM. coh, Coherence.