Figure 3.
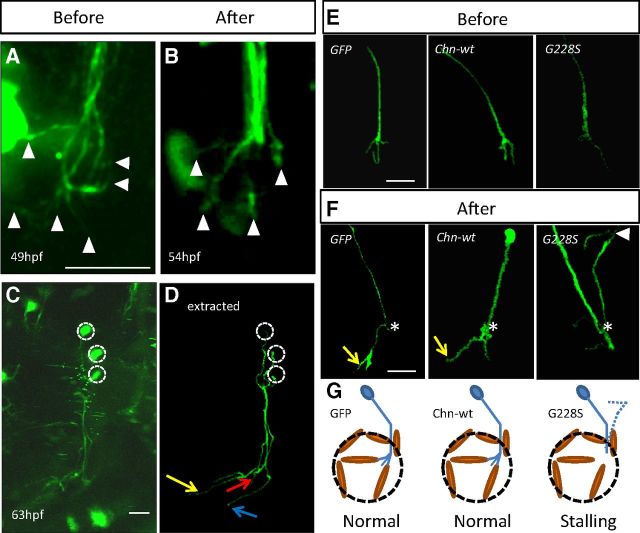
Imaging of single OMN neurons. Live-imaging of single neurons within the OMN expressing GFP before (A) or after (B) the transition point. Arrowheads indicate filopodia. Live-imaging (C) and fluorescently-extracted (D) images of neurons within the OMN producing distinct branches at 63 hpf. Colored arrows indicate distinct neural projections. Single neurons expressing either GFP, WT-α2-chn-wt or the G228S-α2-chn mutant form before (E) or after (F) the 52 hpf transition point. The yellow arrow indicates branches growing into the muscle area. *Branching/stalling point. Arrowhead indicates a neural projection heading dorsally from the branching point. Schematic representation of the phenotype observed in these embryos after the transition point (G) with stalling in G228S-α2-chn-expressing neurons. Dotted lines indicate projections heading dorsally in some cases. All panels are oriented with rostral left and dorsal to the top. Scale bars, 25 μm.

