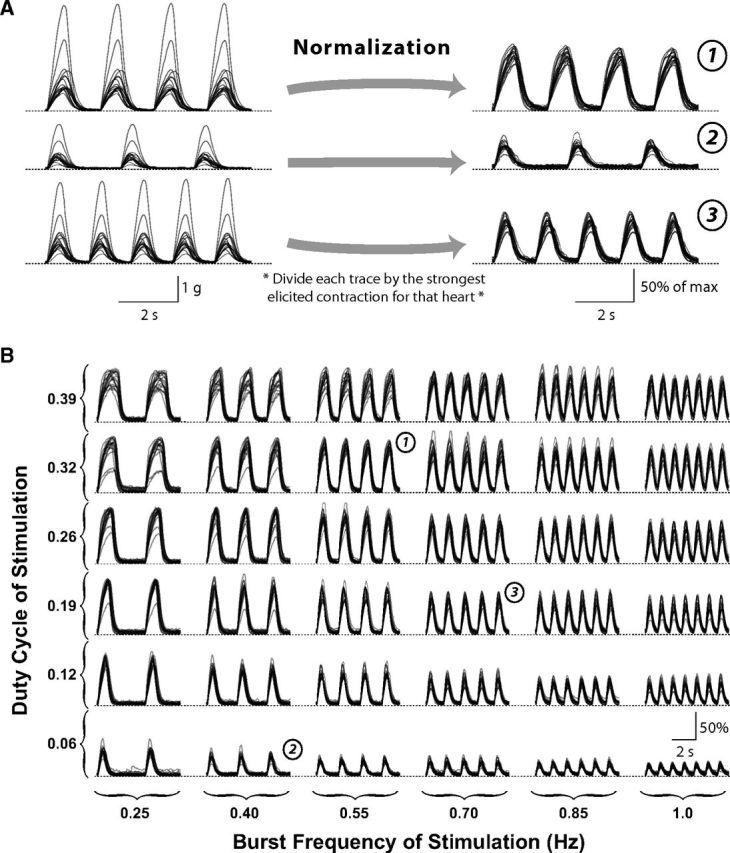
Figure 2.

The cardiac NMT measured in 16 stimulated heart preparations. Muscle movement traces from each preparation are overlaid. A, Response of the hearts to three representative patterns of electrical stimulation (see B, matching circled numbers). Traces on the left represent raw movement recordings, which vary significantly in amplitude. Traces on the right represent normalized by dividing each trace by the peak amplitude for that heart across all stimulation patterns. B, Normalized steady-state movement recordings for each of the 36 stimulation patterns.
