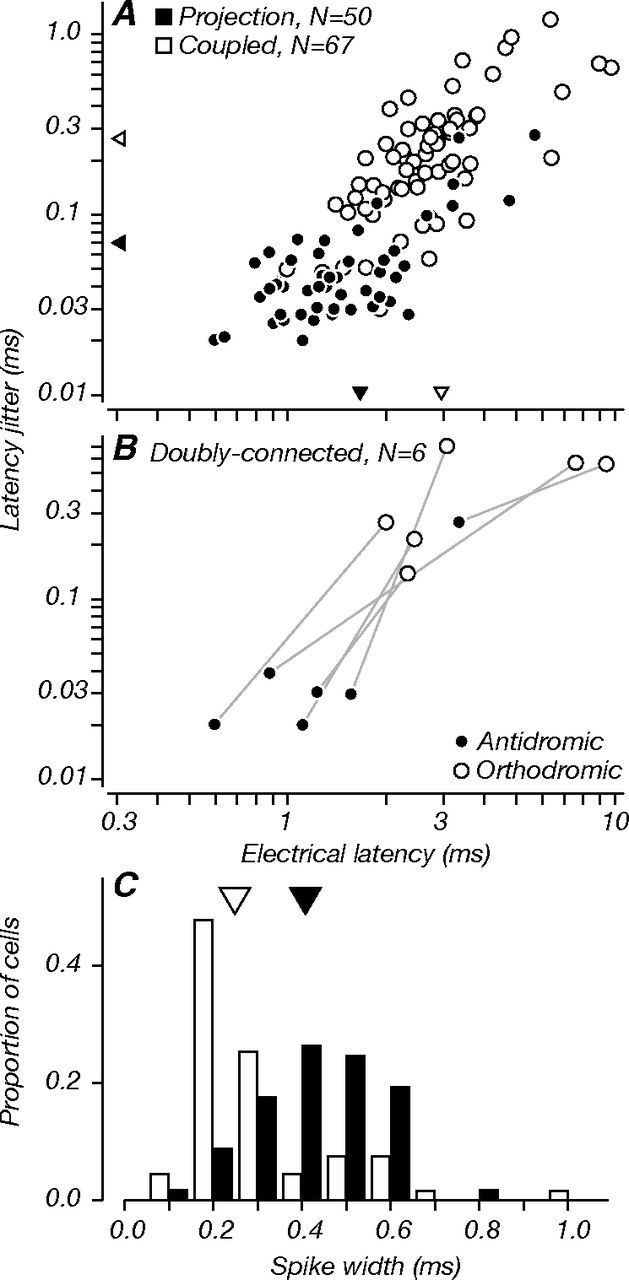
Figure 4.

Electrical latency, latency jitter, and spike width. Latency was measured as the average time from the foot of the electrical artifact to the foot of the poststimulus spike. Jitter was measured as the SD of poststimulus spike latencies. A, Electrical latency versus jitter for all connected neurons for which we saved collision test data (N = 117). On average, projection neurons (black) had shorter electrical latencies (mean, 1.67 ms; triangles) than coupled neurons (white, 2.97 ms); projection neurons also had less jitter (mean, 0.07 ms) than coupled neurons (0.27 ms). Both differences were significant (p < 0.001). B, Same measurements for doubly connected cells (N = 6; as in Fig. 2C,D). Values are shown separately for antidromic and orthodromic spikes. In the same neurons, latency and jitter were considerably lower for antidromic spikes compared to orthodromic spikes. Note that in A, we include the data for the antidromic spikes of doubly connected cells, but not their orthodromic spikes. C, Distributions of spike width, measured as the time from largest trough to the largest peak of the spike waveform. Projection neurons had broader spike waveforms (mean, 0.43 ms) than coupled neurons (mean, 0.31 ms), consistent with the notion that most projection neurons are regular-spiking excitatory neurons. Coupled neurons with very narrow spike waveforms (∼0.20 ms) may be fast-spiking inhibitory interneurons. The difference between the distribution means was statistically significant (p < 0.001).
