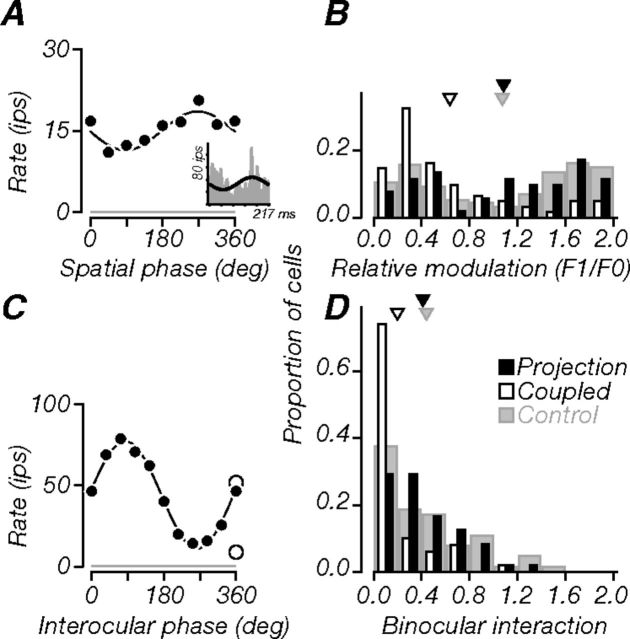
Figure 7.
Monocular and binocular phase. A, Tuning of a projection neuron (same as in previous figures) for the spatial phase of monocularly presented flashed gratings. The black line is a sinusoidal fit to the responses. The neuron showed weak modulation (amplitude to offset ratio, 0.24). Inset, Cycle-average response measured at the optimal spatial frequency in a separate experiment (F1/F0, 0.51). B, Population distributions of relative response modulation ratio. Projection neurons could be either simple or complex; their distribution was similar to that of controls, but tended more often to be simple. Thus, V2 receives strong spatial phase information. C, Tuning for relative interocular phase of drifting gratings presented binocularly (filled circles). The black line is a sinusoidal fit to the binocular responses; responses to monocular gratings are also shown (open circles). Binocular responses were strongly modulated around the monocular conditions, suggesting tuning for grating disparity; the BII was 0.75. Gray lines in A and C indicate baseline firing. D, Population distributions of BII. Many projection neurons (52%) had BII values above 0.3 (criterion for significance) and were on average more sensitive to binocular disparity than coupled neurons but as sensitive as controls. Triangles in B and D indicate population means.

