Figure 8.

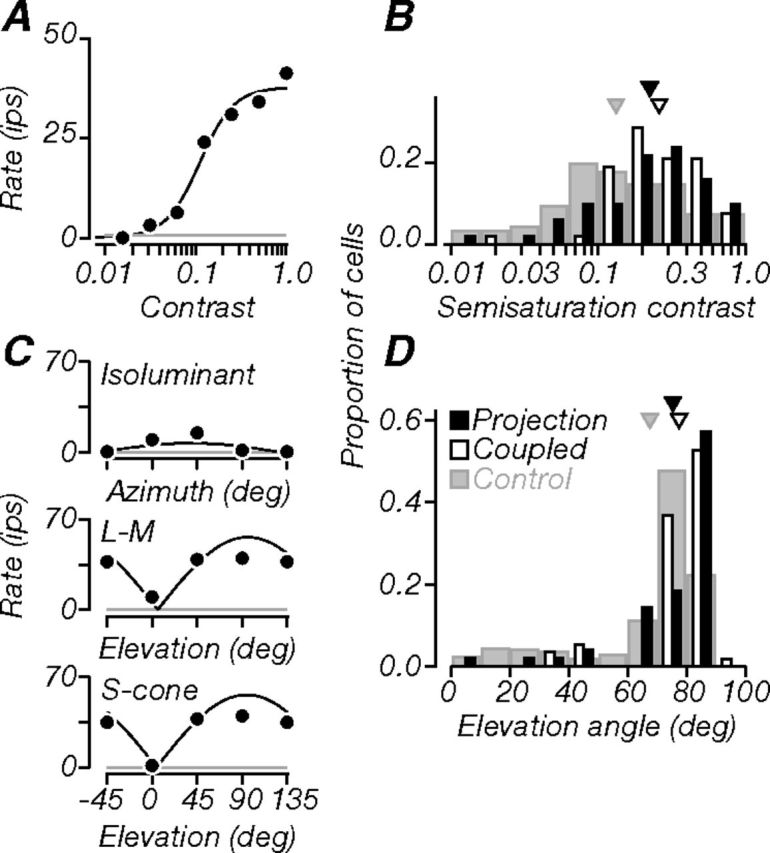
Contrast and color. A Contrast-response function of a projection neuron (same as in previous figures). It was moderately sensitive to luminance contrast (semisaturation contrast, 0.11). B Population distribution of semisaturation contrast. Projection neurons were on average as sensitive as coupled neurons, but both had lower contrast sensitivity than control data. C, Responses along three planes in the color space used in our experiments: azimuth in the isoluminant plane (top, chromatic modulation), elevation through the constant B axis (middle, L–M cone modulation), and elevation through the constant R–G axis (bottom, S cone modulation). A neuron's color selectivity was defined by fitting these responses with a linear model (black lines; see Materials and Methods) and extracting the preferred direction in color space. We used the preferred elevation to characterize cells (see Materials and Methods). The example neuron had a preferred elevation of 83°, and therefore preferred luminance stimuli. Gray lines in A and C indicate baseline firing. D, Population distributions of preferred elevation angles. Projection and coupled neurons tended to prefer higher elevation angles; compared to controls, most projection neurons (>50%) were better driven by luminance than chromatic stimuli. Triangles in B and D indicate population means.
