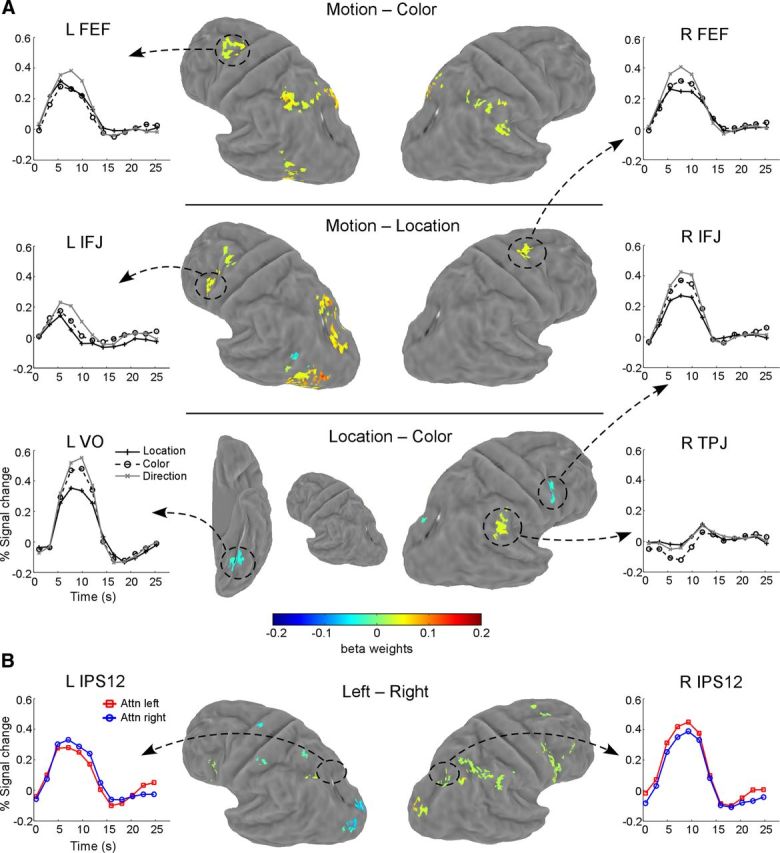
Figure 5.

Maps of whole-brain contrasts. A, Comparison between attention types (location, color, and motion). Each row shows one contrast map on an atlas surface. Mean time courses in several select areas are also shown for illustration purpose only. B, Comparison between cues within each dimension. Shown here is a map for attention to left versus attention to right contrast. Time courses from the retinotopically defined IPS1/IPS2 region are shown to illustrate the effect of spatial attention. Contrasts between the two colors (red vs green) and two directions (up vs down) did not produce any significant activation. VO, Ventral occipital; TPJ: temporal parietal junction.
