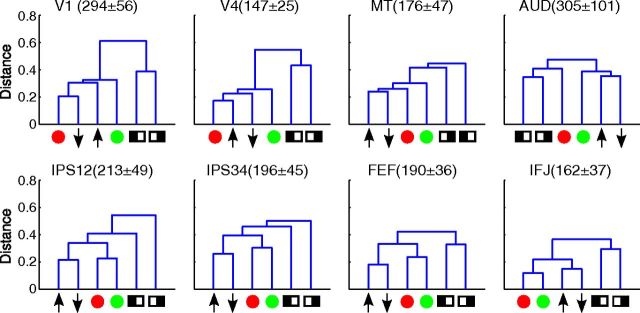
Figure 7.
Dendrograms showing results from the clustering analysis. The vertical axis is the distance (1 − r) between different cue conditions. Symbols represented different cue conditions, in the same format as in Figure 6. The numbers in parenthesis are the average size of each ROI across participants, in number of voxels (mean ± SD).

