
Figure 4.
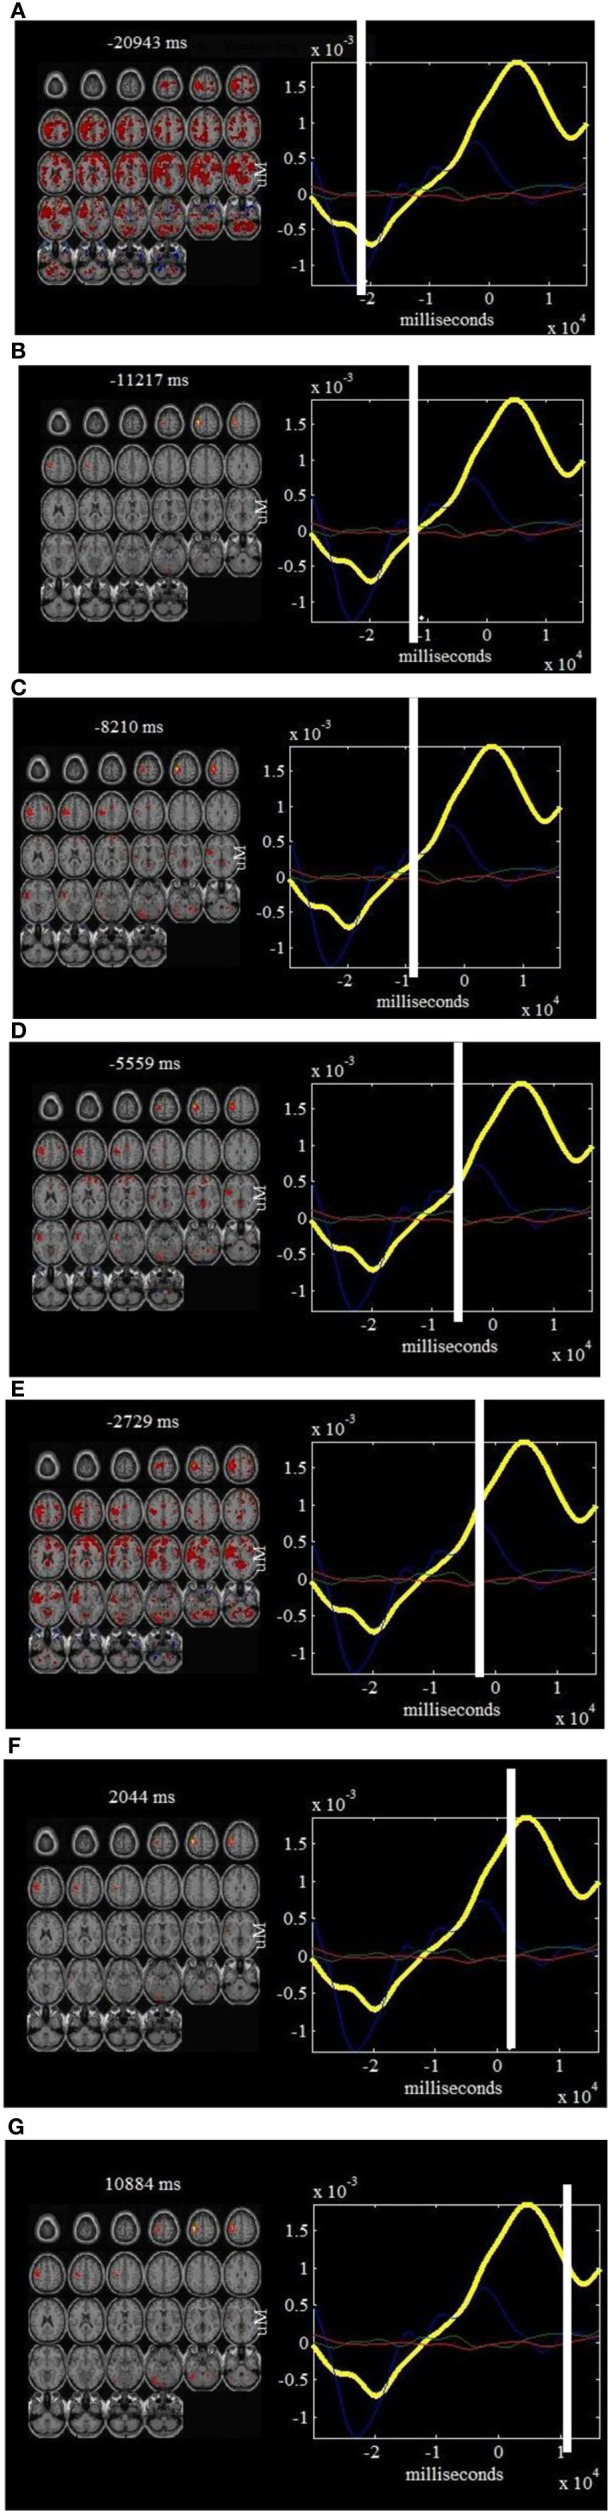
ΔHbO2 components and fMRI “snapshots”: on the left of each window is shown a linear combination of the fMRI maps that are well-correlated with finger tapping tasks (composite ICs 2, 4, and 5), weighted by the ΔHbO2 part of the components at a specific point in time. On the right of each window is shown the estimated ΔHbO2 components that are correlated with right finger tapping tasks. The time courses for IC2 (in blue), IC4 (in green) and IC5 (in red) are also plotted on the right of each window. Such a display provides a dynamic way to visualize the brain activity at different time points: −20943 ms (A), −11217 ms (B), −8210 ms (C), −5559 ms (D), −2729 ms (E), 2044 ms (F) and 10884 ms (G).