
Figure 6.
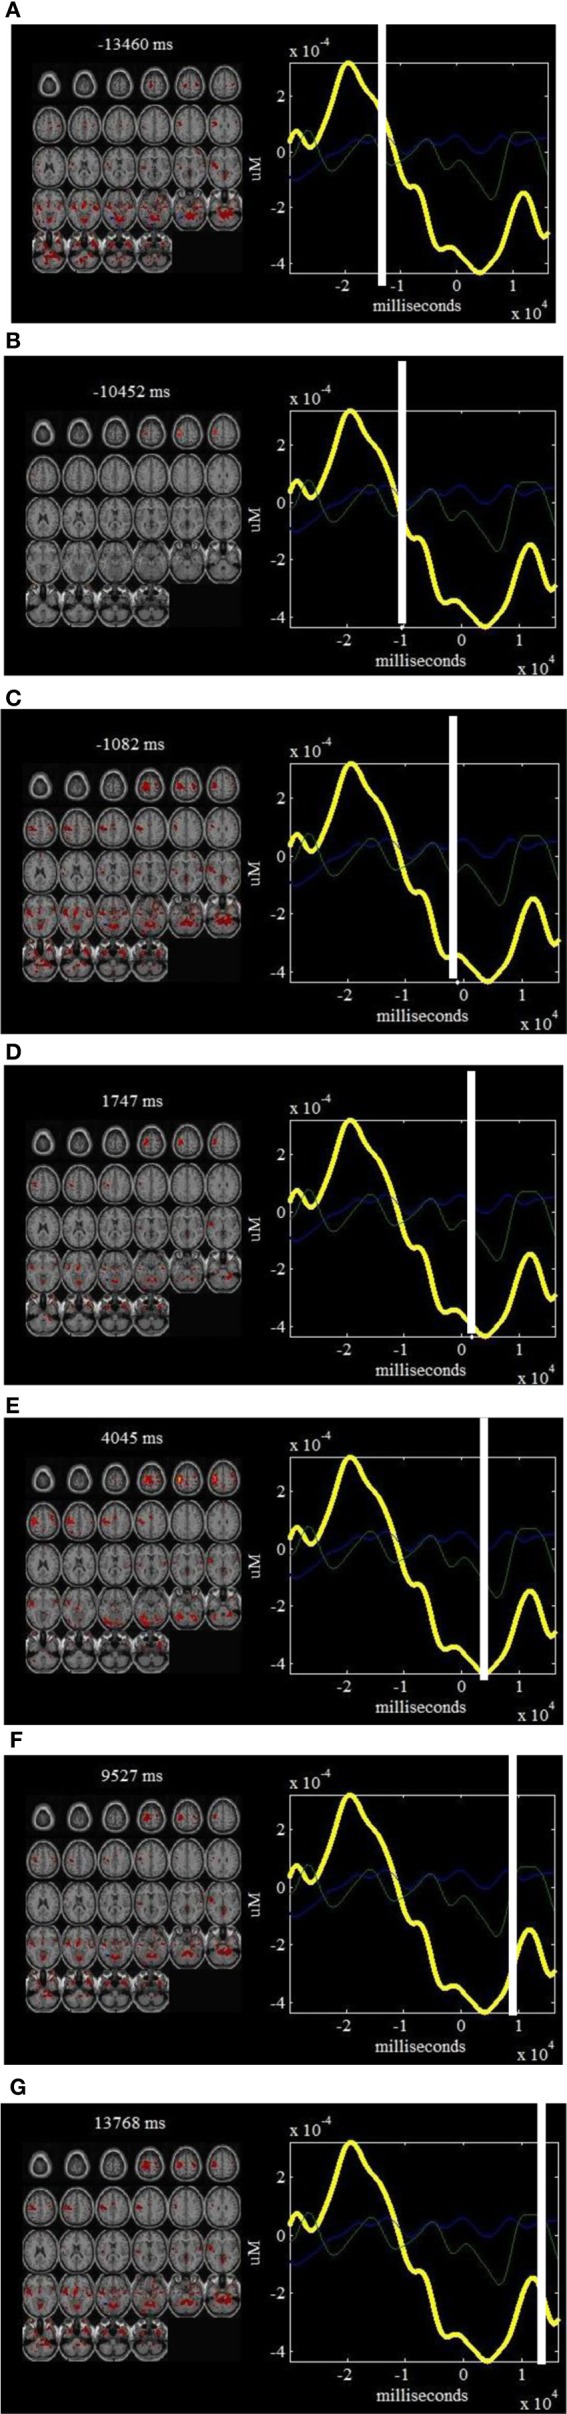
ΔHbR components and fMRI “snapshots”: on the left of each window is shown a linear combination of the fMRI maps that are well-correlated with finger tapping tasks (composite ICs 1 and 3), weighted by the ΔHbR part of the components at a specific point in time. On the right of each window is shown the estimated ΔHbR components that are correlated with right finger tapping tasks. The time courses for IC1 (in blue) and IC3 (in green) are also plotted on the right of each window. Such a display provides a dynamic way to visualize the brain activity at different time points: −13460 ms (A), −10452 ms (B), −1082 ms (C), 1747 ms (D), 4045 ms (E), 9527 ms (F) and 13768 ms (G).