
Figure 1. Manhattan plot of Immunochip association statistics highlighting atopic dermatitis susceptibility loci.
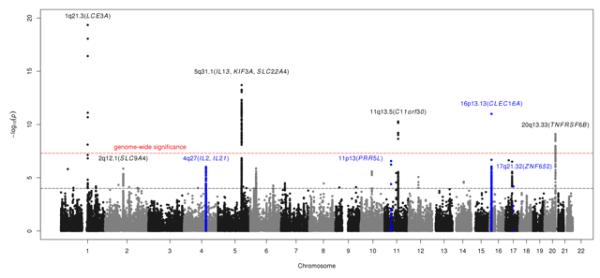
Red horizontal line indicates a genome-wide significance threshold of 5×10⁻⁸. Black horizontal line indicates threshold for follow-up genotyping of the most strongly associated SNPs (n=34) with PImmunochip<10−4 from each associated locus in an independent case-control collection (panel B in Supplementary Table 1).
SNPs within 5 known (Table 1a) and 4 newly associated loci (depicted in blue; Table 1b) achieve the genome-wide significance threshold for association with atopic dermatitis in the combined analysis of Immunochip discovery and replication (panel A-C, Supplementary Table 1).