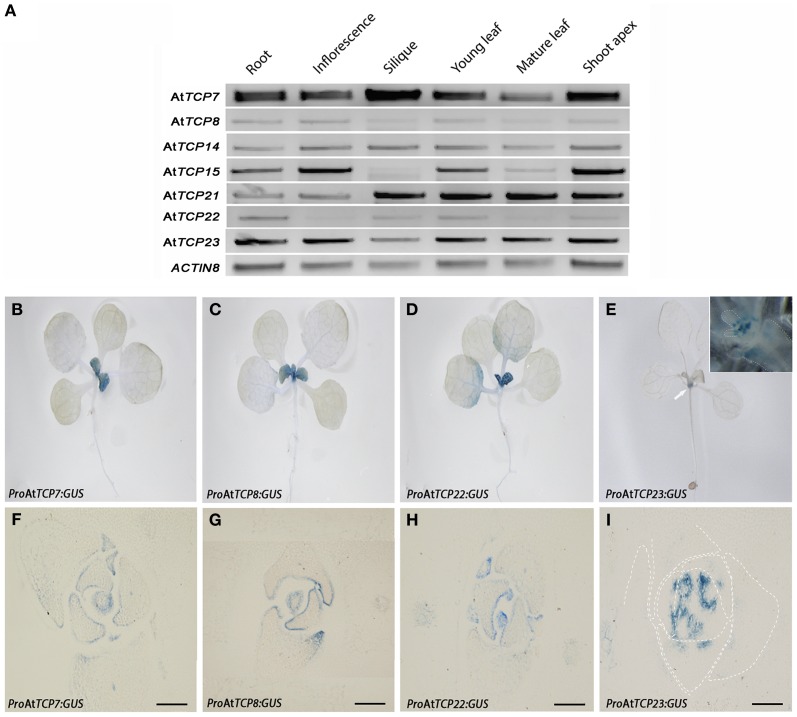
Figure 2.
Expression pattern of class I TCP genes. (A) RT-PCR analysis of the tissue expression of class I TCP genes. ACTIN8 was used as control gene. (B–I) Analysis of the expression pattern using the reporter marker uidA fused to the promoters of the genes in 12 days-old T3 transgenic plants. (B) ProAtTCP7:GUS; (C) ProAtTCP8:GUS; (D) ProAtTCP22:GUS; (E) ProAtTCP23:GUS. Inset, shoot apex, dashed lines indicate leaf primordia or leaf petiole margins. Arrow indicates the localization of the GUS signal. (F–I) Cross-sections of 12 days-old T3 lines. (F) ProAtTCP7:GUS; (G) ProAtTCP8:GUS; (H) ProAtTCP22:GUS; (I) ProAtTCP23:GUS. Dashed lines indicate leaf primordia. Bars = 100 μm.

