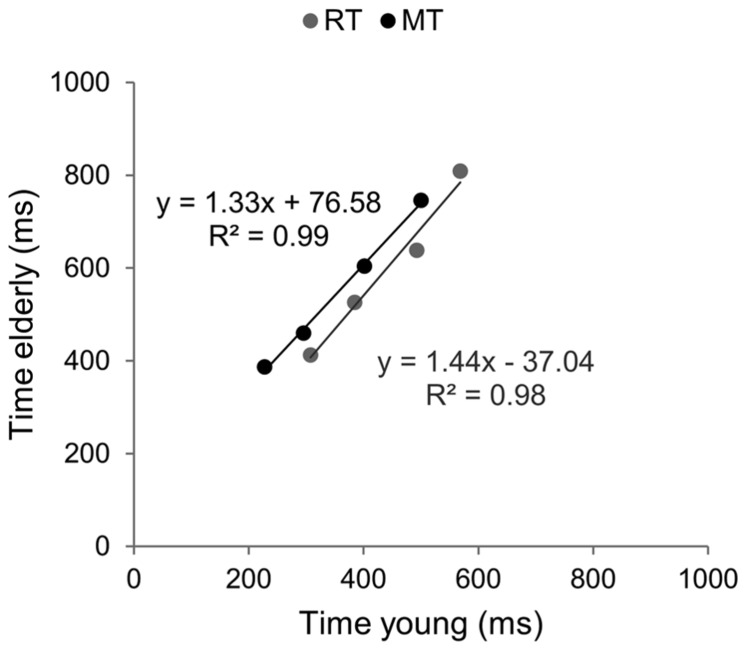
FIGURE 4.
Brinley plots without the hardest ID condition. Data and linear regression estimates of reaction time (observed in Hick–Hyman’s task) are presented in gray and those of movement time (observed in Fitts’ task) are presented in black. Data points correspond to the first four ID conditions of each task, respectively.

