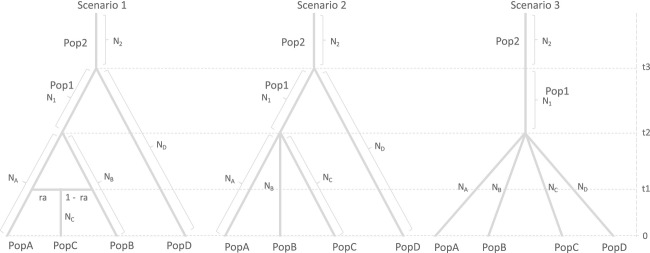
Figure 2.

The three scenarios of population demography examined in DIYABC. t# is time scale measured in generations and N# is effective population size of the corresponding populations (Pop A, B, C, D, 1, and 2) during the time period (e.g., 0–t1, t1–t2, t2–t3).
