Figure 6.

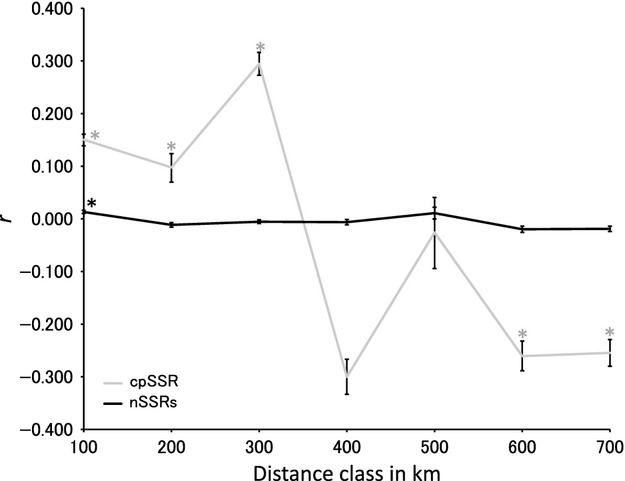
Spatial genetic structure in nuclear and chloroplast SSRs evaluated by the autocorrelation coefficient, r (Smouse and Peakall 1999). The asterisk marks the distance classes showing a significant coefficient.

Spatial genetic structure in nuclear and chloroplast SSRs evaluated by the autocorrelation coefficient, r (Smouse and Peakall 1999). The asterisk marks the distance classes showing a significant coefficient.