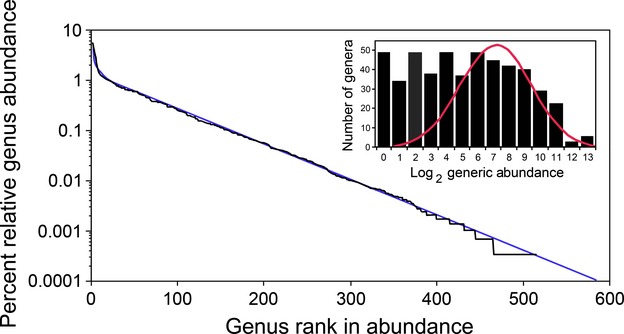
Figure 3.

The fit of Fisher's log series to the rank-abundance curve for Amazonian tree genera. After Hubbell et al. (2008), based on data from ter Steege et al. (2006) from more than 750 plots throughout Amazonia. The black line represents the observed abundance data and the blue line is the fitted log series with α = 71. The insert graph displays the same abundance data with genera binned into doubling classes of abundance, following Preston (1948). The red line is the best-fit lognormal distribution, fit to the data to the right of the mode. The lognormal fails to fit the distribution for rare genera, whose abundances are in the abundance classes to the left of the mode. The flat top of the distribution for rare taxa is characteristic of log series distributions for high-diversity communities.
