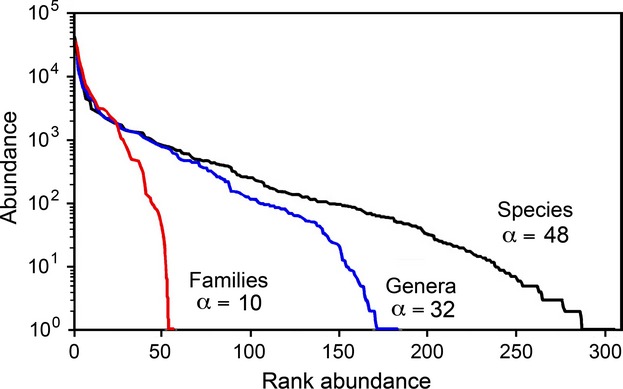
Figure 4.

Rank-abundance curves Barro Colorado Island (BCI) trees and shrubs in the 50 ha BCI plot for three levels of taxonomic aggregation: species, genera, and families. As expected, Fisher's α becomes progressively smaller for higher taxonomic levels, reflecting the lower origination rates of the higher taxa.
