
Figure 7.
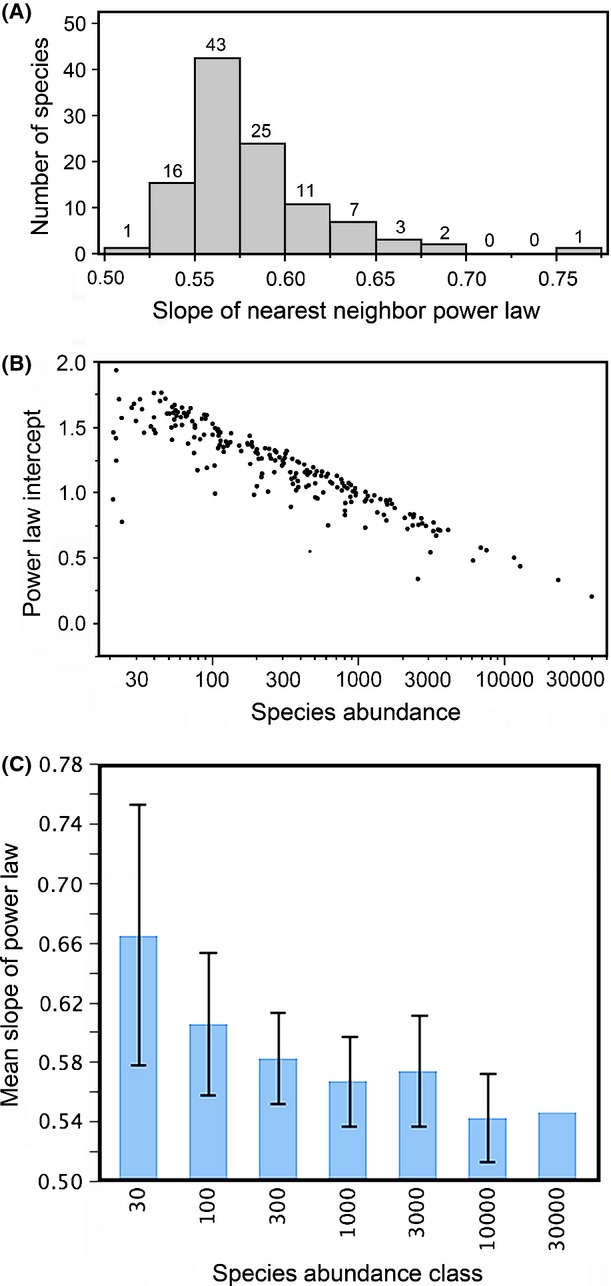
Distribution of the nearest neighbor power-law parameters. Panel A: Distribution of the slopes of the power laws. One expects a slope of 0.5 for randomly distributed species. Slopes >0.5 indicate aggregation. The modal slope category is between 0.55 and 0.60, indicating a moderate level of aggregation. Panel B: The relationship between log abundance of species and the intercept of the power law for the given species. The intercept is the first nearest neighbor distance. As expected, rare species exhibit greater first nearest neighbor distances than do common species. Panel C: The relationship between the slope of the nearest neighbor power law and the log abundance of species, binned into classes of log(10) abundance of width 0.5. Rare species have steeper slopes because nearest neighbors of order higher than the first are also more distant than in common species. The error bars are one standard deviation of the data, not of the mean.