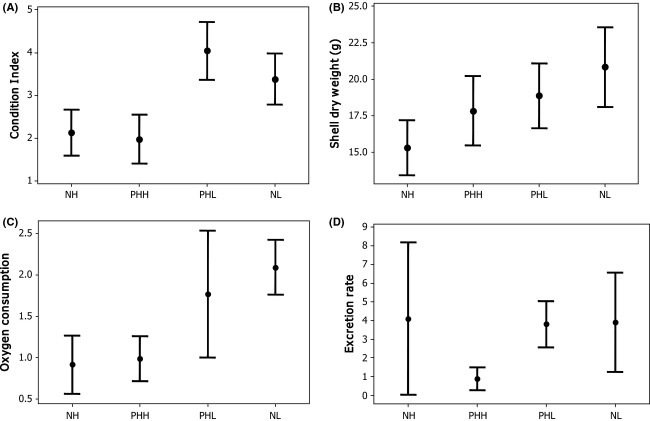
Figure 2.
95% confidence intervals for mean values based on pooled standard deviation of (A) condition index; (B) shell dry weight (g); (C) oxygen consumption rates (mL/O2/h, corrected to a standardized weight of an individual); and (D) excretion rates (NH4 μmol/L/dry weights [g]/individual/h, corrected to a standardized weight of an individual). X-axis symbols: NH: 24°C, normal pH; PHH: 24°C low pH; PHL: 19°C low pH; NL: 19°C normal pH.

