Figure 2.

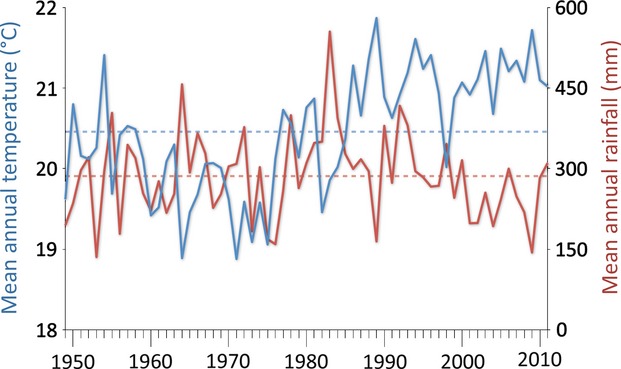
Mean annual air temperatures and rainfall in Tucson, 1949–2011. Dashed lines indicate 63-year means. Data from U.S. National Weather Service, Tucson, WPO-AP.

Mean annual air temperatures and rainfall in Tucson, 1949–2011. Dashed lines indicate 63-year means. Data from U.S. National Weather Service, Tucson, WPO-AP.