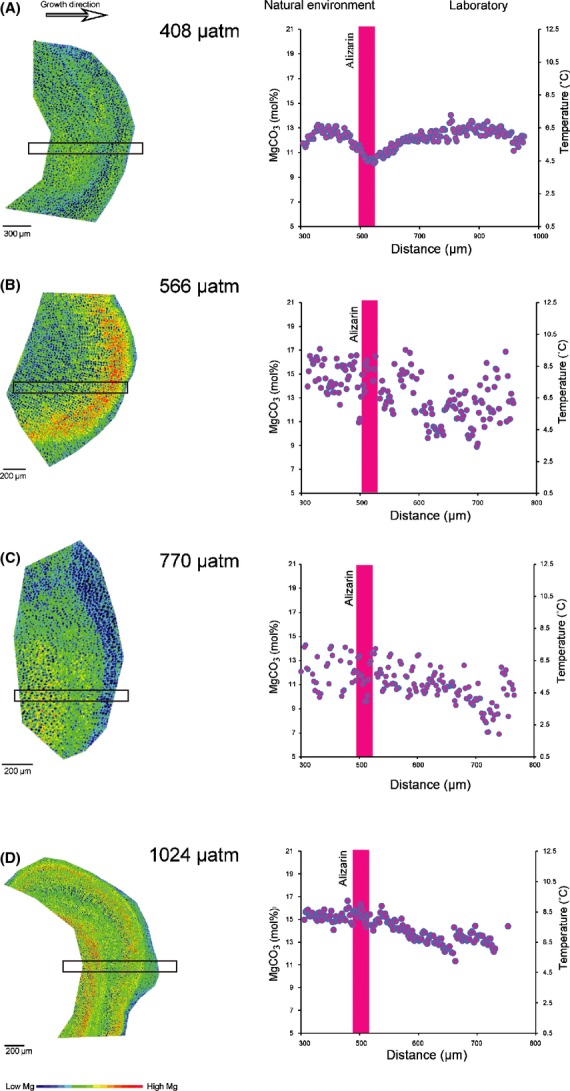
Figure 2.

MgCO3 [mol%] under the four different pCO2 levels (n = 4). Three transects were taken from each electron probe map and averaged with data displayed to the right. The red line demarks the start of the experiment. Reconstructed temperature (°C) is shown on the secondary vertical axis using Lithothamnion glaciale temperature equation from Kamenos et al. 2008.
