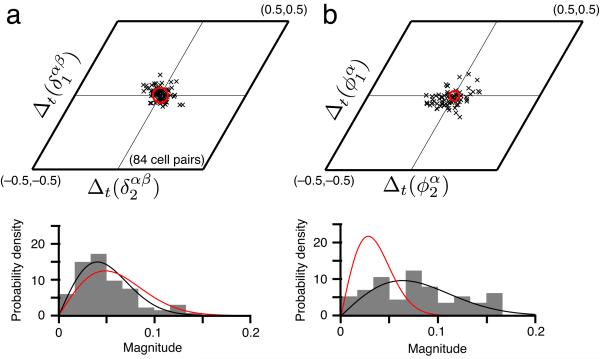
Figure 2.
Across time in familiar environments, the relative phases between cells are more stable than the phases of single cells. (a) Top: The difference across time (trials separated by > 60 mins) in the relative phase between cell pairs is clustered near zero (black x’s, see Online Methods). Red circle: uncertainty in estimating relative phase differences (see Online Methods for error analysis). Bottom: Normalized histogram of the magnitudes of these relative phase differences (gray), with the null distribution (red), in which phase differences are not significantly different from zero and drawn independently from a Gaussian with standard deviation equal to the uncertainty in phase estimation. The null distribution of magnitudes is Rayleigh. Black: best-fit Rayleigh distribution to the data. (b) Difference across time (i.e., trials) of the phase of single cells (top), and the normalized histogram of magnitudes (bottom). Black, red defined similarly as in a. The data in a are not significantly different from the null hypothesis, while those in b are (a: P = 0.58 » 0.05, b: P « 10–4 under the F-test for whether the data and the null distribution come from a distribution of the same variance). Finally, P < 0.001 under the F-test for whether the data in a, b (bottom) come from a distribution of the same variance.

