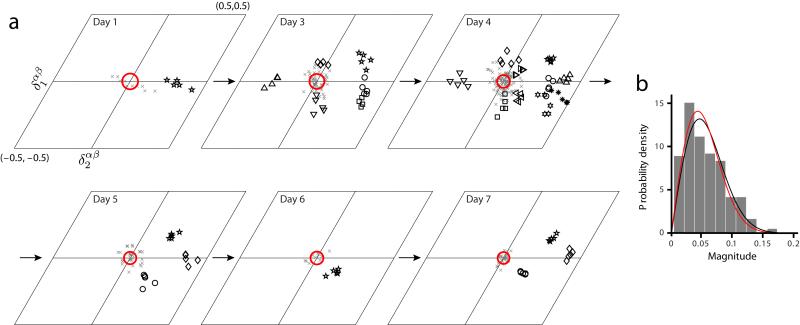
Figure 5.
Relative phase remains stable in novel enclosures. (a) The relative phases of the cell pairs (each distinct symbol represents a pair), across different trials and days (N = 24 cell pairs from ref. 31, across all 7 days). Gray x’s: the relative phase difference for every trial and all pairs. Red circle: uncertainty in the magnitude of relative phase differences (Online Methods). (b) The relative phase differences are not significantly different from zero for the same null hypothesis as in Fig. 2 (P = 0.38 » 0.05 under the F-test for whether the data and the null distribution come from a distribution of the same variance).

