Figure 1.

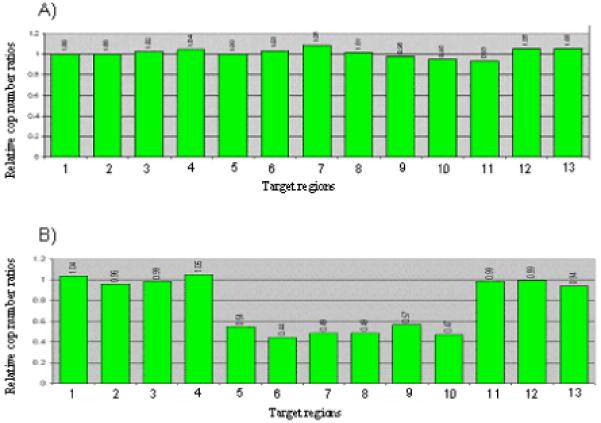
MLPA results for 1q41q42.12 microdeletion screening. Normalized peak height graphs are shown for two CDH patients. (A) a CDH patient without a 1q41q42.12 microdeletion (B) Patient 3, the previously reported Fryns phenotype patient [Kantarci et al., 2006]. Each bar represents the normalized peak height for the probe focusing on a gene on the X-axis, and is arranged in genomic order. Bars 1-2: Contol regions on 15q26. Bar 3: PTPN14 (212,768,242-212,791,265 at 1q41); Bar 4: USH2A (214,413,915-214,663,361 at 1q41); Bar 5 EPRS (218,227,107-218,286,623 at 1q41); Bar 6: BPNT1 (218,297,696-218,329,814 at 1q41); Bar 7: DUSP10 (219,941,389-219,982,084 at 1q41); Bar 8: CAPN2 (222,011,949-222,030,343 at 1q41); Bar 9: LBR (223,660,887-223,682,407at 1q41.12); Bar 10: ACBD3 (224,399,003-224,441,046 at 1q41.12); Bar 11: ITKPKB (224,961,518-224,993,499 at 1q41.12); Bar 12: PSEN2 (225,129,689-225,150,427 at 1q41.12 at 1q41.13); and Bar 13: TAF5L (227,801,564-227,828,417 at 1q42.13).
Note that the deletion extends from EPRS to ACBD3 in (B) Patient 3.
