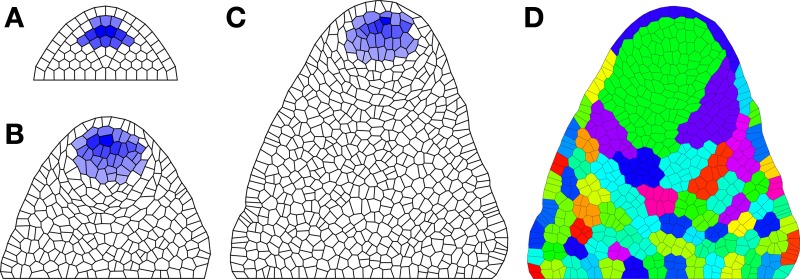
Figure 3.
Maintenance of organizing center during growth simulation. (A) Initial distribution of W; (B) Distribution after 250 cell divisions; and (C) Distribution after 500 cell divisions. (D) Cell lineages; each color shows a different clonal population corresponding to all descendants of a particular cell in (A). Parameters: k1 = 2, k2 = 0.2, k3 = 1, k4 = 0.25, k5 = 1, k6 = 0.05, k8 = 1.5, k9 = 0.1, DU = 10, DV = 0.5, DX = 0.5, vX = 1, vW = 1, vV = 1, hX = 0, hW = 0, hV = 0, TWX = 4, TWV = 4, TUW = 22.5, TVW = −25, TWW = 27.5, p0 = 0.001, p1 = 0.004, μ0 = 5 × 10⁻⁶, μ1 = .004.

