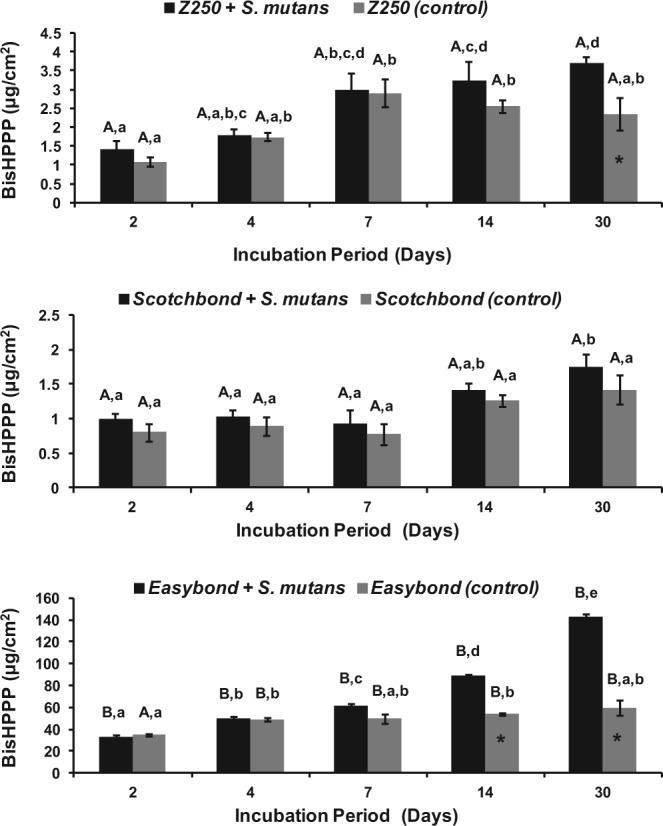
Figure 2.

Cumulative amounts of BisHPPP production after incubation of a resin composite (Z250) (top), total-etch adhesive (SB) (middle), and self-etch adhesive (EB) (bottom) in BHI with S. mutans UA159 (black) and with BHI alone (gray). Data are plotted with standard error of the mean. *represents significant differences between the two incubation conditions for each material at the same time-point (p < .05). Values with the same lower case letter denote statistically non-significant differences within each material’s group (p > .05). Values with the same capital letters indicate non-significant differences among materials (p > .05).
