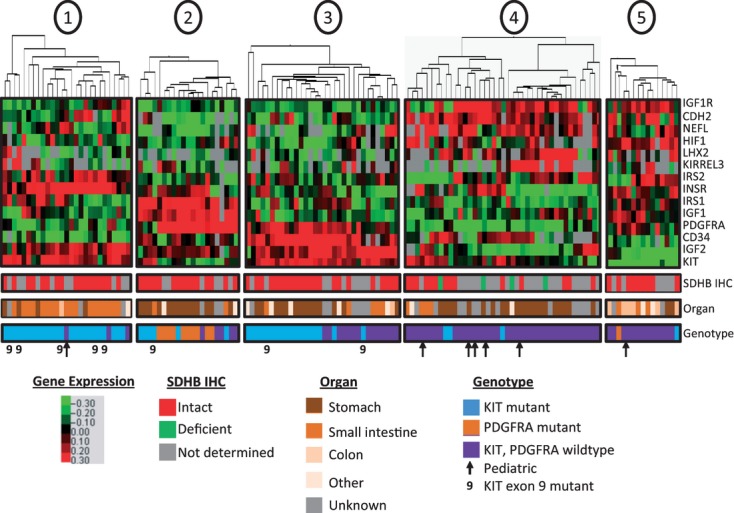
Figure 2.

Gene expression clusters define GIST subtypes. Self-organizing cluster analysis of the relative expression of 14 target genes relative to GAPDH identified five expression groups among 138 GIST specimens. Red indicates high relative expression and green indicates low relative expression. Location of the primary tumor is listed as stomach, small intestine, other, or unknown. SDHB immunohistochemistry was performed on 82 of the specimens, and was categorized as intact or deficient, as indicated. KIT and PDGFRA mutation status are illustrated in blue or orange, respectively, with nine indicating KIT exon 9 mutations. Pediatric specimens are indicated by arrows. GIST, gastrointestinal stromal tumor; PDGFRA, platelet-derived growth factor receptor alpha.
