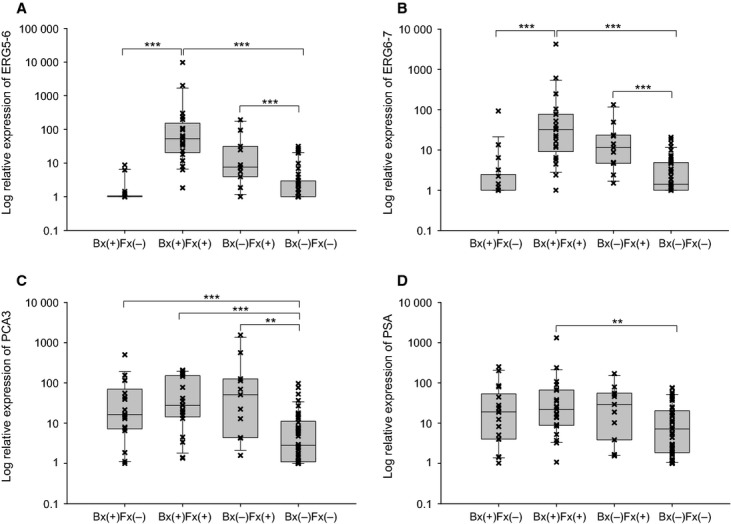
Figure 1.

Distinctive molecular subgroups stratified by biopsy outcomes and fusion status in urine. A total of 92 biopsy patients were stratified into the four subgroups based on biopsy outcomes (Bx) and fusion status (Fx): Bx(+)/Fx(−) (n = 18), Bx(+)/Fx(+) (n = 21), Bx(−)/Fx(+) (n = 11), and Bx(−)/Fx(−) (n = 42). (A, B), the expression levels of two ERG markers (ERG [5–6] and [6–7], respectively) in urine were stratified by Bx and Fx status. (C, D), the expression levels of PCA3 and PSA in urine were stratified by Bx and Fx status. The relative expression was calculated using ∆∆ threshold cycle method and transformed into log(x + 1) values. Mann–Whitney test was performed (**P < 0.01, and ***P < 0.001).
