
Figure 2.
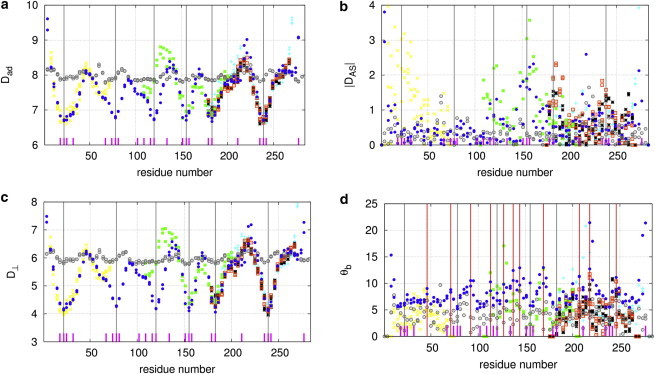
Results of local flexibility analysis of Tm in the absence of F-actin in comparison with x-ray structures of Tm fragments using four parameters: (a), (b), (c), and θb (d). The gray vertical lines mark the center positions of six Ala clusters (A22, A78, A120, A155, A183, and A239). The positions of individual core Ala residues are marked by short dashes. The red vertical lines in d mark peaks of average θb. The data points are represented as follows: MD simulations of system 1  , PDB structures 2d3e
 , 1ic2
 , 2efr
 , 2efs
 , and 2b9c
 , and the initial model from Li et al. (28)
  .To see this figure in color, go online.