
Figure 3.
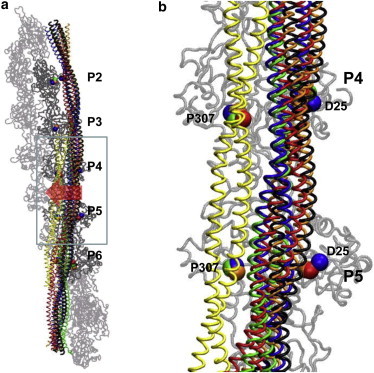
Average structures of Tm bound with F-actin in comparison with the Tm models at the closed and open positions. (a) Global view of the entire Tm bound with F-actin. (b) Enlarged view of periods P4 and P5 in Tm. The average structures of Tm from four aMD simulations are colored blue, red, green, and orange; the Tm model at the closed position (28) is colored black; and the Tm model at the open position (57) is colored yellow. Two actin residues (D25 and P307) are shown as reference points for the closed and open positions of Tm and colored the same as Tm. Five actin subunits in contact with periods P2–P6 of Tm are colored dark gray, and those not in contact with Tm are colored light gray. The block arrow in a indicates the shift of Tm from the closed position to the open position.