
Figure 5.
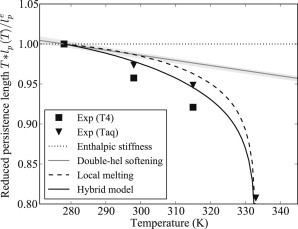
Persistence length of sequence-averaged DNA, multiplied by temperature and rescaled by its value at 278 K. In this representation, a purely enthalpic stiffness yields a temperature-independent value (dotted line). The markers ▾ and ■ are the experimental data points from Geggier et al. (37) obtained with two types of ligase enzymes. Gray solid line: MD-derived values of the persistence length, with the estimated error bars (shaded area), i.e., the contribution from the double-helical elasticity; dashed line: contribution predicted from the denaturation bubbles (9); black solid line: the hybrid model, including both contributions.