
Fig. 3.
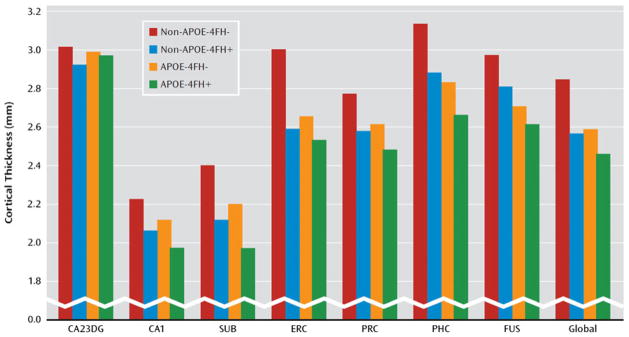
Structural MRI (from Donix et al. 2010a. Reprinted with permission from the American Journal of Psychiatry, (Copyright ©2010). American Psychiatric Association). The figure displays cortical thickness values for the possible APOE and family history risk factor combinations among cognitively healthy subjects. CA23DG cornu ammonis fields 2, 3 and dentate gyrus; CA1 cornu ammonis field 1; SUB subiculum; ERC entorhinal cortex; PRC perirhinal cortex; PHC parahippocampal cortex; FUS fusiform cortex; Global average cortical thickness across all medial temporal lobe subregions; FH family history; “+” = positive; “−” = negative