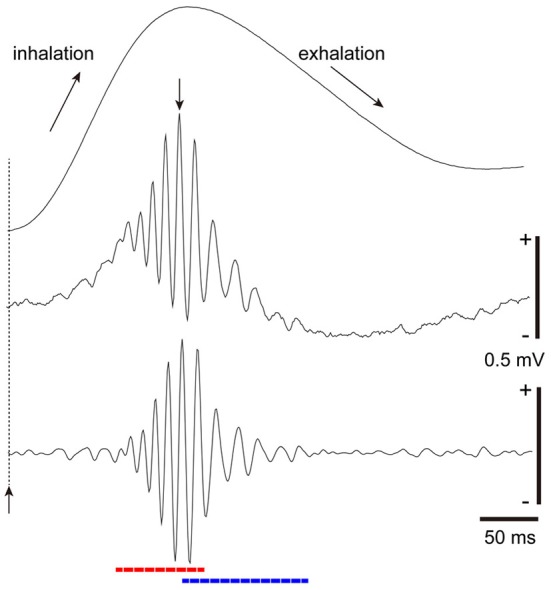
Figure 4.

Fast and slow gamma oscillations in the olfactory bulb. Middle trace: sniff rhythm-paced gamma oscillations recorded from the granule cell layer of the olfactory bulb of a freely behaving rat. The sniff-induced local field potentials (LFPs) were averaged (n = 277 sniffs) in reference to the peak (a downward arrow) of gamma oscillations that occur near the phase of transition from inhalation to exhalation. Bottom trace: the local field potential shown in the middle trace was band-path filtered between 30 and 140 Hz. The sniff-paced gamma oscillations consist of early-onset fast gamma oscillation (red dashed line) and later-onset slow gamma oscillation (blue dashed line). Uppermost trace: respiration monitor via a thermocouple implanted in the nasal cavity. Upward reflection indicates inhalation. Sniff-onset is indicated by a vertical broken line with an upward arrow.
