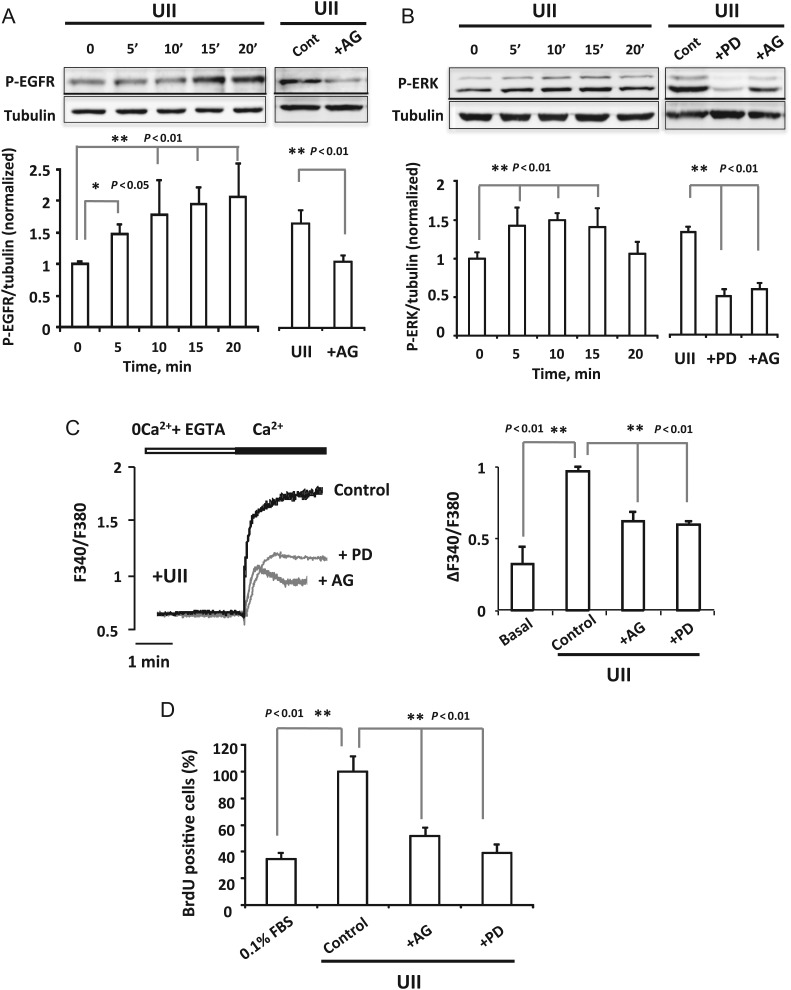
Figure 5.
Role of EGFR and ERK phosphorylation in UII-induced Ca2+ influx and proliferation. (A and B) Left panels, western blot and summary data showing the time course of UII activation of EGFR and ERK, respectively. (A) Right panel, western blot and data showing the amount of activation of EGFR in cells treated 10 min with Urotensin-II (100 nM; Cont) and in cells pre-treated 15 min with the EGFR inhibitor, AG1478 (100 nM; +AG) before the addition of Urotensin-II (100 nM, 10 min). (B) Right panel shows the effect of the ERK inhibitor, PD98059 (10 μM; +PD) and the EGFR inhibitor, AG1478 (100 nM; +AG) in cells pre-treated 15 min with the inhibitors before the addition of Urotensin-II (100 nM, 10 min). Results are mean ± SEM (n = 4). (C) Representative traces and summary data showing [Ca2+]i changes recorded in VSMCs treated 5 min with UII (100 nM). Data are from control VSMCs; and for cells pre-incubated 15 min with PD98059 (10 μM; +PD) and AG1478 (100 nM; +AG) before Urotensin-II (100 nM). n = 65–170 cells from four to five different culture. (D) Data summary indicating the per cent of BrdU positive cells in quiescent VSMCs (0.1%FBS); in cells treated 48 h with Urotensin-II (100 nM; control) and in cells pre-incubated 15 min with AG1478 (100 nM; +AG) or with PD98059 (10 μM; +PD) before Urotensin-II (100 nM). n = 5 cultures.

