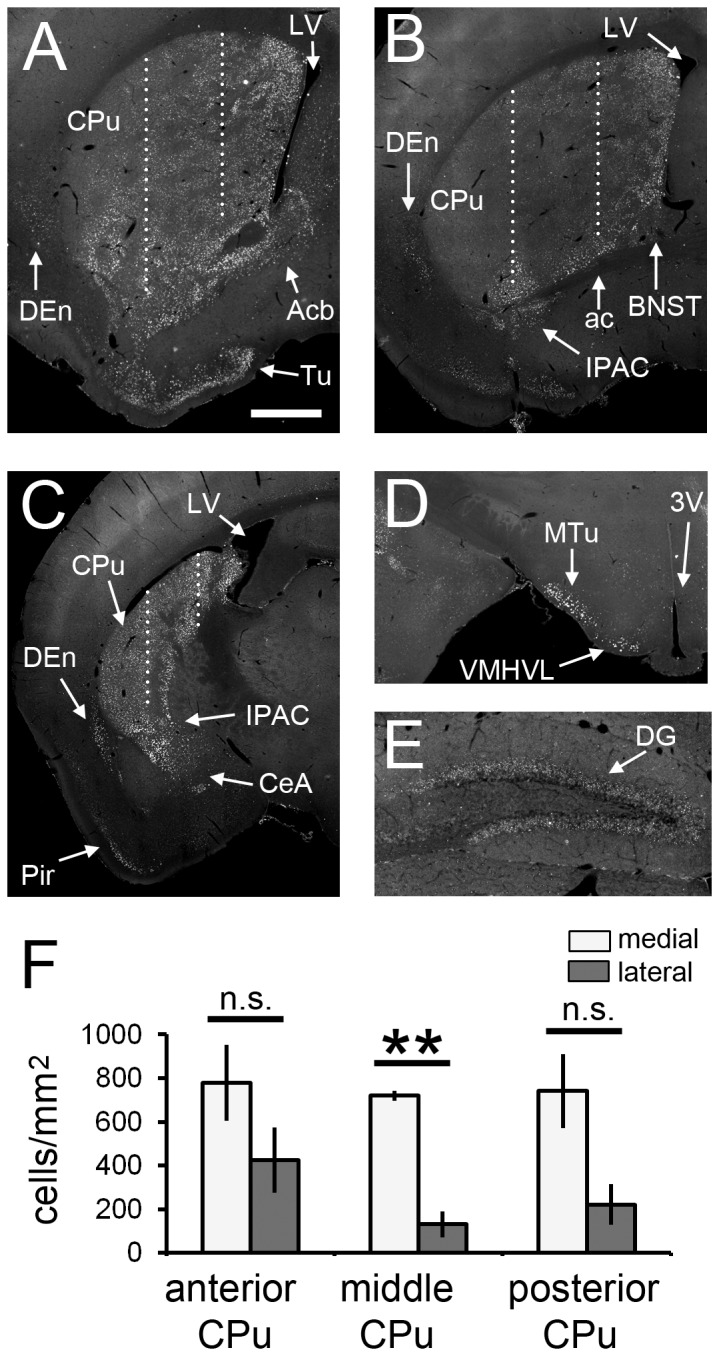
Figure 3. Distribution of PH3+ cells in the SE brain at 1 h.

Anterior (A), middle (B) and posterior (C) parts are shown (see Materials and Methods). Stacked epifluorescence microscopy images are shown. Significant signals are detected in the CPu (A-C), nucleus accumbens (A), bed nucleus of the stria terminalis (B), interstitial nucleus of the posterior limb of the anterior commissure (B and C), dorsal endopiriform nucleus (A-C), piriform cortex (C), central amygdala (C), medial tuberal nucleus (D), ventromedial hypothalamic nucleus, ventrolateral part (D) and dentate gyrus of the hippocampus (E). (F) The CPu was divided into three parts with vertical lines (dotted lines in A-C; see Materials and Methods for detail), and the densities of PH3+ cells were compared between the medial and the lateral regions. Three animals were analyzed (n = 3). Two-tailed Welch’s t-test. **p < 0.01. White bars, medial region of CPu; gray bars, lateral regions of CPu; n.s., not significant. 3V: third ventricle; ac: anterior commissure; Acb: nucleus accumbens; BNST: bed nucleus of the stria terminalis; CeA: central amygdala; DEn: dorsal endopiriform nucleus; dG: dentate gyrus of the hippocampus; IPAC: interstitial nucleus of the posterior limb of the anterior commissure; LV: lateral ventricle; MTu: medial tuberal nucleus; Pir: piriform cortex; Tu: olfactory tubercle; VMHVL: ventromedial hypothalamic nucleus, ventrolateral part. Scale bar = 600 μm for A-D and 200 μm for E.
